8th Grade Math: Statistics & Probability Linear Relations Frequency Tables Slope
- PDF
Also included in
- This is a common core bundle of middle school math units for Numeracy, Expressions & Equations, Functions, Geometry, and Statistics and Probability. It includes detailed 3-part lesson plans, project lesson slides, activities and assessments . "This unit is excellent! It provides simple to usePrice $50.00Original Price $67.00Save $17.00
Description
This middle school math unit for Statistics and Probability (data management) includes detailed Google 3-part lesson plans, projectable lesson slides, activities, and assessments that correspond to the Common Core Math curriculum for 8th grade.
This unit is part of our ENTIRE YEAR OF COMMON CORE MATH PACKAGE which includes all of our math resources for Grade 8th Grade.
"This unit is excellent! It provides simple to use lessons that cover Statistics and Probability and align to the common core standards for grade 8. I love that each lesson opens with a minds on activity to get students thinking and it comes with presentation slides that will save me time planning. I can't wait to use this resource in my classroom." - satisfied buyer.
WHAT'S INCLUDED?
⇧ See the detailed PREVIEW for a clear idea of what to expect with your purchase ⇧
LESSON PLANS
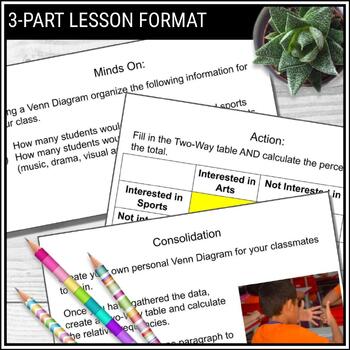
We have created lessons that correspond to each of the expectations of the Ontario curriculum. All lessons follow a 3-part format including expectations, learning goals, examples, minds on activities, action activities, extension/discussion activities, and consolidation activities. In some instances, there are two lessons to cover an expectation because of the depth and/or difficulty. I would suggest you move on at pace appropriate for your students.
Grade Level Lessons
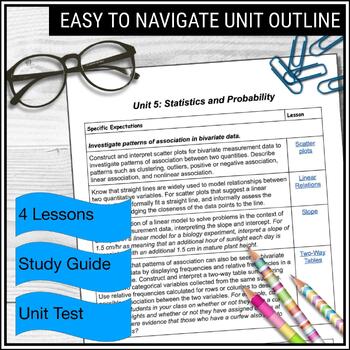
- Lesson 1: Scatter plots
- Lesson 2: Linear relations
- Lesson 3: Slope
- Lesson 4: Two-way tables
GOOGLE SLIDES presentation for each lesson
I project these in my classroom for students to see. It reduces photocopies and makes life much easier because setup is done in advance.
TRACKING TEMPLATES to help you record student learning and grades.
STUDY GUIDE AND UNIT TEST (with answer key)
Please Note: We will be adding new files to this resource based on new ideas and customer feedback. When you buy the resource at the introductory price (uploaded January 2019), you will receive all of the updates and upgrades.
♻ We strive to be environmentally conscious by creating digital products. Please don't print more than is necessary!
RELATED PRODUCTS
Buy the entire year of 8th grade common core standards math units and save money!
8th Grade Common Core Math Units Bundle for the Entire Year
Each 8th grade common core math unit is available separately:
▼▼▼▼▼▼▼▼▼▼▼▼▼▼▼▼▼▼▼▼▼▼▼▼▼▼▼▼▼▼▼▼▼▼▼▼▼▼▼▼▼▼▼▼▼▼▼▼▼▼▼▼▼▼▼▼▼▼▼▼▼▼▼▼▼▼▼▼▼▼▼▼▼▼▼▼▼▼▼▼▼▼
If you like this product don’t forget to leave positive FEEDBACK. Not only does it help others find it, but you also EARN CREDITS towards future purchases!
_________________________________________________________________________________________
Join our MAILING LIST for product notifications, freebies and updates straight into your mailbox!!
TERMS OF USE - © Past The Potholes Ltd.
This item is a paid digital download from my TpT store: www.teacherspayteachers.com/Store/Past-The-Potholes
It is for personal use in one classroom only. Copies are only allowed for your own classroom use.
This item is bound by copyright laws. Redistributing, editing, selling, or posting this item (or any part thereof) on the internet are all strictly prohibited without first gaining permission from the author. Violations are subject to the penalties of the Digital Millennium Copyright Act.


