TPT
Total:
$0.00

AP Statistics Unit 1: Ch1: Data Analysis Complete Lesson: StatsMedic Aligned

;
Math with Ms Li
6 Followers
Grade Levels
10th - 12th
Standards
Formats Included
  • PDF
Pages
73 pages
$10.00
$10.00
Share this resource
Report this resource to TPT
Math with Ms Li
6 Followers

Description

Hello! Are you a teacher that uses StatsMedic for AP Statistics? If you're like me and like to teach the lesson along with a powerpoint or tablet, this completed lesson guide will be useful for you! The PDF/PPT has time stamps for the activity, big idea content such as vocabulary, and practice problems to work on with your class. This lesson is specifically for all activities in StatsMedic related to Chapter 1: Data Analysis. For the complete UNIT 1 lessons (Chapter 1 and Chapter 2), check out my page for bundle deals.

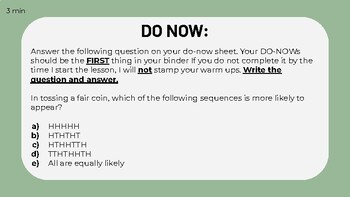
I teach on a BLOCK schedule, so this is oriented towards 90 minute classes. If you want to split it into 45 minute lessons, just cut the lesson at the end of each activity. It includes warm-ups for every class and time stamps to help you pace the lesson. If you want more information on how to use this guide to pace your teaching, please let me know! This should cut down your planning time. Only requires that you print the assignments and activities for your students.

Total Pages
73 pages
Answer Key
N/A
Teaching Duration
90 minutes
Report this resource to TPT
Reported resources will be reviewed by our team. Report this resource to let us know if this resource violates TPT’s content guidelines.

Standards

to see state-specific standards (only available in the US).
Represent data with plots on the real number line (dot plots, histograms, and box plots).
Use statistics appropriate to the shape of the data distribution to compare center (median, mean) and spread (interquartile range, standard deviation) of two or more different data sets.
Interpret differences in shape, center, and spread in the context of the data sets, accounting for possible effects of extreme data points (outliers).
Use the mean and standard deviation of a data set to fit it to a normal distribution and to estimate population percentages. Recognize that there are data sets for which such a procedure is not appropriate. Use calculators, spreadsheets, and tables to estimate areas under the normal curve.

Reviews

Questions & Answers

6 Followers