High School Math IEP Goal Bank - Statistics and Probability
- Word Document File
Description
This IEP goal bank was created to assist special education teachers with the task of writing standards-based IEP goals in math. After spending countless hours developing IEP goals myself and really having to think through how to best individualize goals and objectives for my own students, I wanted to share this resource to help other special education teachers gain back some of their time.
This goal bank includes the following:
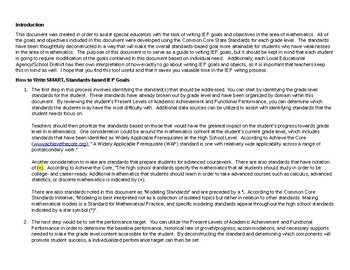
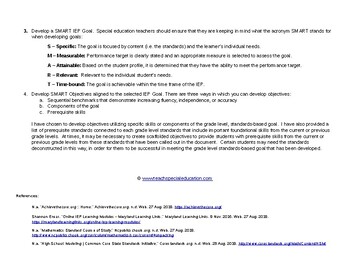
- An introduction and guide that explains how to use the document.
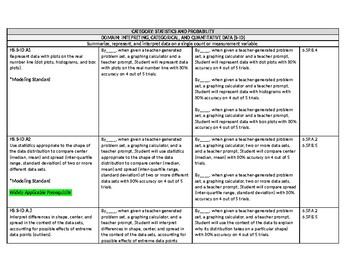
- Each standard for the Category: Statistics and Probability.
- Scaffolded objectives that are based on the deconstructed standard.
- A list of prerequisite standards that support the student in being successful in accessing the grade level standard.
- Highlighted content (e.g. Modeling Standards, Widely Applicable Standards) which can help special educators in prioritizing content focus.
This document is formatted in Word so that you can easily modify the goals to meet the individual needs of your students.
Other products from my store:
Grades PreK-5 English Language Arts Common Core IEP Goal Bank
Grades PreK-2 English Language Arts Common Core IEP Goal Bank
Grades 3-5 English Language Arts Common Core IEP Goal Bank
Grades 6-8 English Language Arts Common Core IEP Goal Bank
Grades K-5 Math Common Core IEP Goal Bank
Grades K-2 Math Common Core IEP Goal Bank
Grades 3-5 Math Common Core IEP Goal Bank
Grades 6-8 Math Common Core IEP Goal Bank
High School English Language Arts Common Core IEP Goal Bank
Please note the following:
Purchase of this product allows for one license for one individual only. Sharing of this document is not permitted and if there is a need to multiple users, please plan for the purchase of multiple licenses.


