87 results
High school statistics bulletin board ideas for Microsoft OneDrive
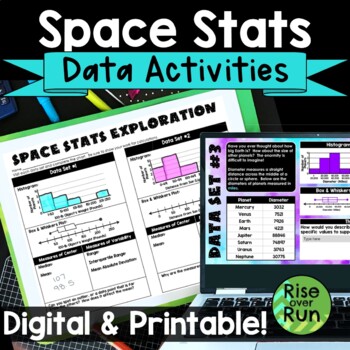
Box and Whiskers Plots and Histograms Activity with Real World Space Statistics
Use statistics for a real world application with this engaging activity about space stats! Students use real data to create histograms, box and whiskers plots, as well as calculate median, mean, range, interquartile range, and mean absolute deviation. This lesson works great for a space room transformation if you choose! Components are included in printable versions for in-person learning and Google Slides + Microsoft PowerPoint for online learning.Here’s what is included:Intro Presentation (Po
Subjects:
Grades:
6th - 9th
Types:
Also included in: Algebra 1 and 8th Grade Math Curriculum Bundle for Entire Year
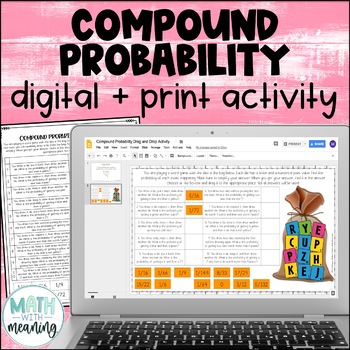
Compound Probability Digital and Print Activity for Google Drive and OneDrive
Looking for an engaging, no-prep activity to practice finding the probability of compound events? Students will use the included image to find the probability of 10 compound events, including both independent and dependent events. They will then find their answer from the answer choices at the bottom and drag it to the appropriate spot. Please view the preview file to make sure that this activity is appropriate for your students.This product includes the following:A link to the digital activity
Subjects:
Grades:
6th - 9th
CCSS:
Also included in: Middle School Math Digital and Print Activity Bundle Volume 1
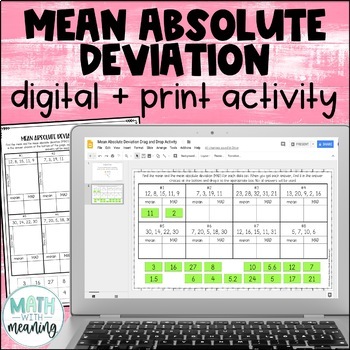
Mean Absolute Deviation MAD Digital and Print Activity for Google Drive
Looking for an engaging, no-prep activity to practice finding the MAD? Students will find the mean and mean absolute deviation for 8 data sets. They will then then find their answer from the answer choices at the bottom and drag it to the appropriate spot. Each data set contains 4-5 numbers. The mean of each data set is a whole number. Please view the preview file to make sure that these types of problems are appropriate for your students.This product includes the following:A link to the activit
Subjects:
Grades:
6th - 9th
CCSS:
Also included in: Middle School Math Digital and Print Activity Bundle Volume 2
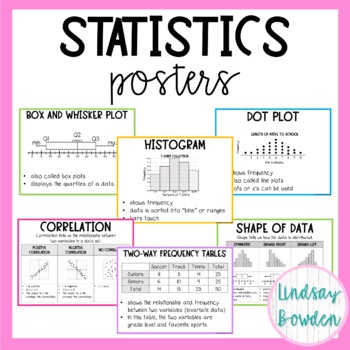
Statistics Posters (Algebra 1 Word Wall)
These statistics posters come with 18 posters on letter paper (8.5" by 11"). They are meant to be printed in color, but you can also print them in black and white.Posters include:box and whisker plots, histograms, stem and leaf, dot, plot, range, interquartile range, measures of central tendency, mean absolute deviation, shape of data, peaks in data, spread of data, scatter plots, correlation, causation vs. correlation, line of best fit, two-way frequency tables, standard deviation, normal dist
Subjects:
Grades:
8th - 10th
Also included in: Statistics Unit Bundle
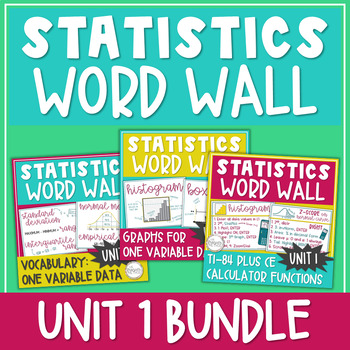
Statistics Word Wall / Statistics Posters / Math Bulletin Board Graphs & Charts
43 PAGES of Statistics Posters to add high school math classroom décor to your math bulletin board, math word wall, hallway, door, or as anchor charts with these 8.5" by 11" Statistics Word Wall Posters filled with STATISTICS GRAPHS, VOCABULARY, & TI-84 PLUS CE CALCULATOR FUNCTIONS! Definitions, formulas, graph features, and step-by-step calculator directions! Everything included in this bundle is from Unit 1: Exploring One-Variable Data in AP Statistics, and the information on each slide a
Subjects:
Grades:
10th - 12th
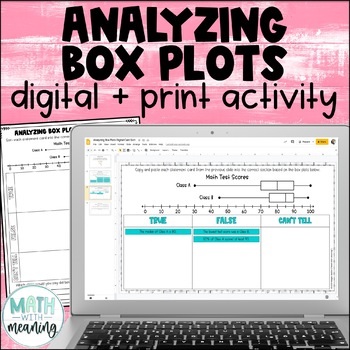
Box and Whisker Plot Digital and Print Card Sort - Reading and Analyzing
Looking for an engaging, no-prep activity to practice reading and analyzing box plots? Students will look at a double box plot and determine if statements about it are true, false, or if they can't tell from the information given in this fun digital and print activity.This activity includes statements about the minimum, maximum, median, quartile 1 (Q1), quartile 3 (Q3), interquartile range (IQR), and range of the box plots, along with statements about the percentages represented by a particular
Subjects:
Grades:
6th - 9th
Also included in: Middle School Math Digital and Print Activity Bundle Volume 3
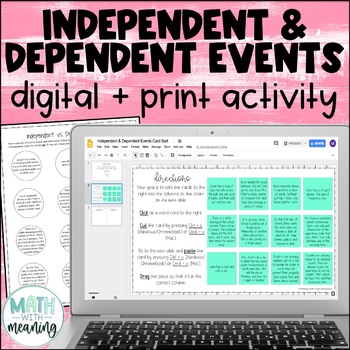
Independent and Dependent Events Digital Print Card Sort - Compound Probability
Looking for an engaging, no-prep activity to practice identifying independent and dependent events? Students will read 12 sets of compound events and determine if they are independent or dependent events. Many examples of real-world events are included. This is a great activity for students learning compound probability who struggle with differentiating between independent and dependent events. Also included is a printable graphic organizer that is perfectly sized for interactive notebooks. Plea
Subjects:
Grades:
6th - 9th
CCSS:
Also included in: Middle School Math Digital and Print Activity Bundle Volume 2
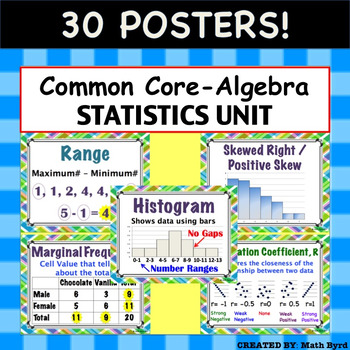
Common Core Algebra - Statistics Unit: Describing Data POSTERS
30 Posters! Each 8.5" x 11" in size. Posters are aligned with Common Core's Algebra - Statistics: Describing Data Unit. Posters Included:MeanMedianModeRangeInterquartile RangeOutlierMean Absolute DeviationMeasures of CenterMeasures of SpreadDot PlotHistogramBox PlotNormal/ Bell Shaped DistributionSkewed Right/Positive SkewSkewed Left/ Negative SkewUniform2 Way Frequency TableJoint FrequencyMarginal Frequency2 Way Relative Frequency TableConditional Relative FrequencyScatter PlotCorrelationCorrel
Subjects:
Grades:
8th - 11th
CCSS:
Also included in: Common Core Algebra 1 POSTERS - BUNDLE PRICE!
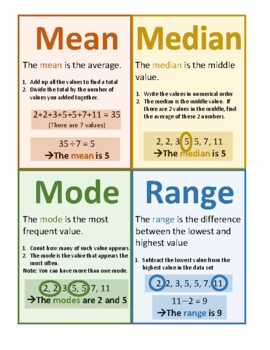
Mean Median Mode Range Poster Notes Anchor Chart
The PDF poster describes mean, median, mode, and range in an easy-to-understand and visual way. Enjoy!Check out my other posters here:STEM: Women in STEM Insp. Quotes, Women in STEM, Careers, Heroes Timeline, Inspirational Quotes from STEM HeroesABCs of Math: STEM Innovations, Amazing STEM facts, Careers, Shapes, in Nature Modern Style, in Nature Vintage Style, in Everyday LifeMath Vocabulary Alphabet: Elementary, Middle School, High SchoolMath in Art: Set A, Set B, Big BundleMath Modelling: Se
Subjects:
Grades:
5th - 9th
Types:
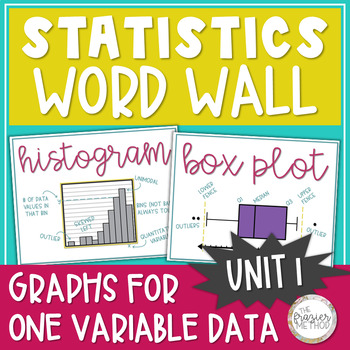
Statistics Word Wall Posters - Histogram, Box Plot, Bar Graph, Dot Plot Unit 1
Use these Statistics Posters to add high school math classroom decor to your bulletin board, hallway, math word wall, or classroom door with these great 8.5" by 11" Statistics Word Wall pages filled with statistics vocabulary, formulas, and graphs! All graphs are from Unit 1: Exploring One-Variable Data in AP Statistics, and the information on each slide aligns with AP College Board's objectives and standards for AP Statistics. ALL PAGES ARE IN COLOR & GRAYSCALE.Size: 8.5 by 11 inches[If you
Subjects:
Grades:
10th - 12th
Statistics In My World Project
This is a great project for students to do at the beginning of a HS statistics class. It will open their eyes to statistics in the media and provides real world interpretation of material learned the first couple weeks of class. The best part - You get lots of decorations for your wall and material to use as you progress through descriptive statistics!
Package includes instructions for teacher, including CCSM standards and objectives; student handout outlining specifics of the project; gradi
Subjects:
Grades:
11th - 12th

Data Literacy in STEM & Digital Technologies | Numerical, Categorical & Digital
Enhance your student's understanding of DATA LITERACY and DIGITAL LITERACY What is Data? Why it's important? How do numerical, categorical, and digital data fit within STEM and DIGITAL TECHNOLOGIES?Well, look no further... This bundle contains everything you need to teach the essentials of DATA LITERACY with absolutely NO PREP REQUIRED.CoveringNumerical DataCategorical DataDigital DataData collectionData analysisData Sorting and FilteringData visualization and representationBinary, QR and more
Grades:
3rd - 10th, Adult Education, Staff
Types:
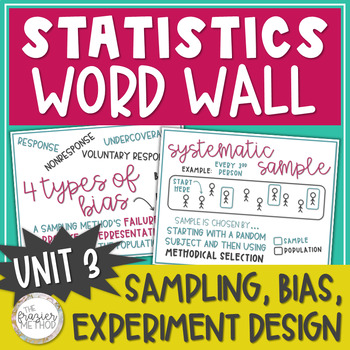
Statistics Word Wall Posters Sampling Methods, Bias, Experiment Design AP Unit 3
Use these Statistics Posters to add high school math classroom decor to your bulletin board, hallway, math word wall, or classroom door with these great 8.5" by 11" Statistics Word Wall pages of SAMPLING METHODS, TYPES OF BIAS, & EXPERIMENTAL DESIGN vocabulary! Put them up one at a time as you teach through each term or display them all at once. 34 PAGESALL PAGES ARE IN COLOR & GRAYSCALE.SIZE: 8.5 x 11 inches All vocabulary terms are from Unit 3: Collecting Data in AP Statistics, and the
Subjects:
Grades:
10th - 12th
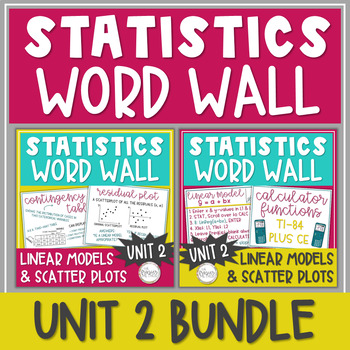
Statistics Word Wall Posters - Two-Way Table, Scatter Plot, Linear Model Unit 2
Use these Statistics Posters to add high school math classroom decor to your bulletin board, hallway, math word wall, or classroom door with these great 8.5" by 11" Statistics Word Wall pages filled with STATISTICS VOCABULARY, GRAPHS, & TI-84 CE CALCULATOR FUNCTIONS! 45 total pages of definitions, formulas, graph features, and step-by-step calculator processes! Put them up one at a time as you teach through the corresponding lessons or display them all at once. Everything included in this bu
Subjects:
Grades:
10th - 12th
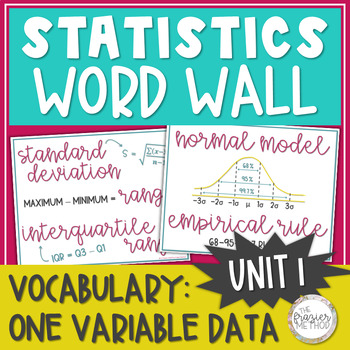
Statistics Word Wall Posters - Normal Model, Median, Mean, Skew, Z-Score Unit 1
Add some high school math classroom decor to your room or hallway with these great 8.5" by 11" statistics posters filled with statistics vocabulary, formulas, and graphs! These pages of AP Statistics decor can be displayed on any math word wall or math bulletin board! All vocabulary, formulas, and graphs are from Unit 1: Exploring One-Variable Data in AP Statistics, and the information on each slide aligns with AP College Board's objectives and standards for AP Statistics. ALL PAGES ARE IN COLOR
Subjects:
Grades:
10th - 12th
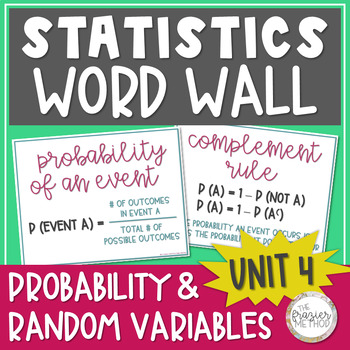
Statistics Word Wall Posters Probability Rules & Random Variables | AP Unit 4
High school math classroom décor made easy with these 8.5" by 11" pages of PROBABILITY RULES, PROBABILITY MODELS, & RANDOM VARIABLES vocabulary from Statistics! These can be displayed on any word wall or bulletin board in your math classroom or hallway. Put them up one at a time as you teach through each term or display them all at once. + 35 PAGES+ ALL PAGES ARE IN COLOR & GRAYSCALE.+ SIZE: 8.5 x 11 inches All vocabulary terms are from Unit 4: Probability & Random Variables, and the
Subjects:
Grades:
10th - 12th
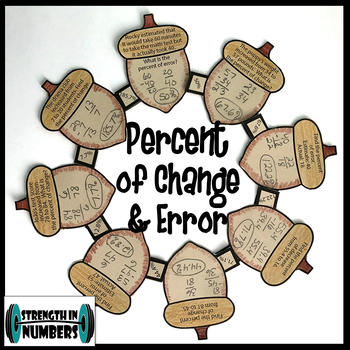
Percent of Change & Error Thanksgiving Fall Acorn Wreath
Your students will love this fall wreath. They will practice eight problems involving percent of error and change. Attaching each piece to the next piece with the correct answer makes a wreath. All my favorite things - self-checking, colorful, and wall-worthy! So adorable to display for Fall, especially Thanksgiving.Don't forget to earn TPT credits towards FREE products when you leave feedback! :)Check out my PAPER CHAINS:One and Two Step InequalitiesEaster – Solving ProportionsBasketball -
Subjects:
Grades:
6th - 9th
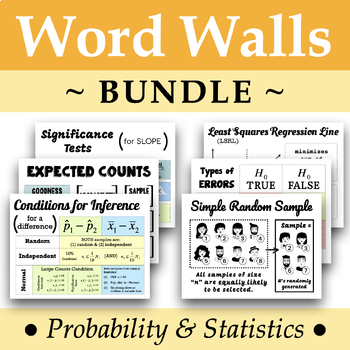
Statistic Word Wall BUNDLE
A bundle of the #1 to #12 Statistics Word Walls.
Subjects:
Grades:
9th - 12th
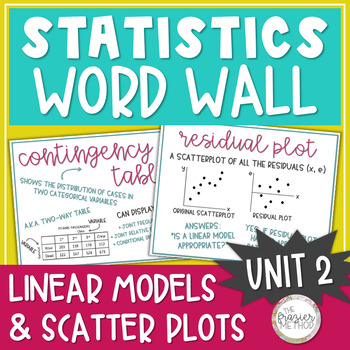
Statistics Word Wall Posters - Scatter Plot, Linear Model, Residual, Correlation
Use these Statistics Posters to add high school math classroom decor to your bulletin board, hallway, math word wall, or classroom door with these great 8.5" by 11" Statistics Word Wall pages filled with statistics vocabulary, formulas, and graphs! \Put them up one at a time as you teach through each term or display them all at once. All vocabulary, formulas, and graphs are from Unit 2: Exploring Two-Variable Data in AP Statistics, and the information on each slide aligns with AP College Board'
Subjects:
Grades:
10th - 12th, Higher Education
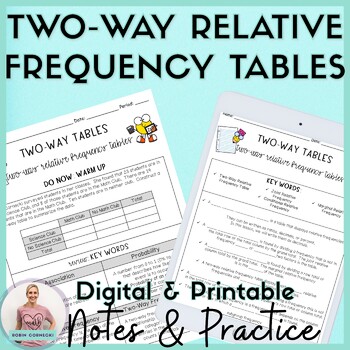
Two Way Relative Frequency Tables Guided Notes Practice HW 8th Grade Math
Two-Way Relative Frequency Tables Guided Notes is everything that you need to teach your middle school math students Constructing and Interpreting Two-Way Relative Frequency Tables. Students will also identify Joint Relative Frequency, Conditional Relative Frequency, and Marginal Relative Frequency through investigation and practice examples. These guided notes and practice worksheets are perfect for a binder or can be reduced in size to fit into an interactive notebook.✅This resource is pe
Subjects:
Grades:
7th - 9th
Types:
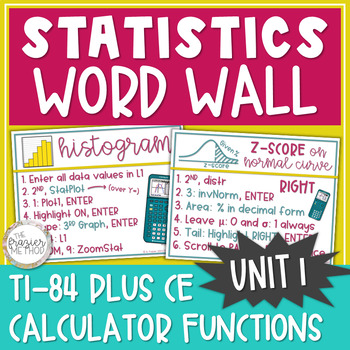
Statistics Word Wall Posters TI 84 Plus CE Calculator Box Plot Histogram Z-Score
Add high school math classroom decorations to your classroom bulletin board, hallway bulletin board, math word wall, or classroom door with these great 8.5" by 11" statistics posters filled with TI-84 CE CALCULATOR FUNCTIONS, such as graphing a histogram and boxplot, 5-Number Summary, area % under the Normal Model, and z-scores! All calculator functions are from Unit 1: Exploring One-Variable Data in AP Statistics, and the information on each slide aligns with AP College Board's objectives and s
Subjects:
Grades:
10th - 12th
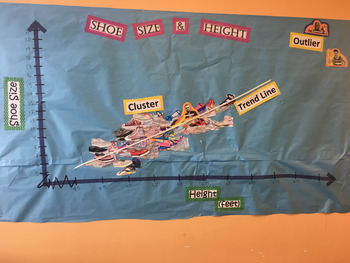
Class Shoe & Height Activity/Lesson
Really fun lesson on Scatterplots!
Each student colored their own mini shoe (included are cut outs of 4 popular shoes) then graphed it on a scatterplot of height and shoe size.. We then discussed clusters, made a trend line, and guessed Celebrity's shoe sizes based on their heights (cut outs also included). Vocab cards for labeling cluster, trend line, and outlier included.
Also includes worksheet for students to make their own scatter plot and answer related questions.
Makes a really cute b
Subjects:
Grades:
6th - 9th
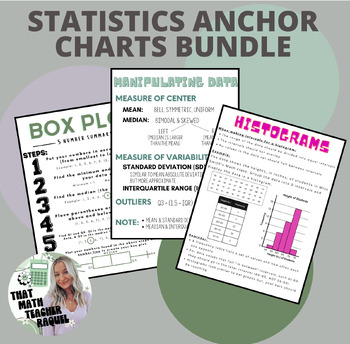
Statistics Anchor Chart Bundle
This Statistics Anchor Charts Bundle (including box plots, histograms, and manipulating data) can be referenced within your classroom while working on your one- and two-variable statistics unit. They are simple, easy to read, and have examples to follow along!There are various sizes for printing:• 8.5 x 11 in• 11 x 14 in• 12 x 18 in• 16 x 20 in• 25 x 30 in• 24 x 36 inI like to project the poster on to my board and trace onto chart paper. When I print my posters, I go to my local Walgreens! Other
Subjects:
Grades:
6th - 12th
Types:

Word Wall Vocab 107 Posters | Scientific Research/ Design Experimentation | HS
Vocabulary Posters for Scientific Research math words and includes 107 WORDS! for all Science/Research/ Statistics class for the entire year! These are perfect for Scientific Research and Design Experimentation that focuses on advance science, statistics and research experiments. Posters are horizontal and measures: 3.75" x 10.5". Perfect for the word wall and includes the following units: *Types of Sampling *Sampling Methods*Qualitative Sampling Methods*Basic Research Design*Quantitative and Qu
Subjects:
Grades:
9th - 12th
Showing 1-24 of 87 results


