5 results
Statistics rubrics for homeschool
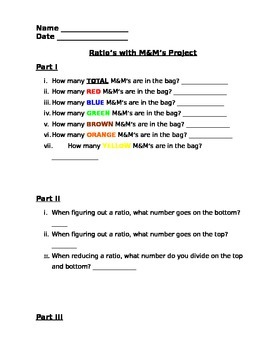
Ratios with M&M's Project
This is a quick assessment to help students figure out the ratios of M&M's in a bag. You provide the candy and I provide the worksheet. Students will be requested to open the bag, count all candies and than follow the directions marking ratios for each listed color.
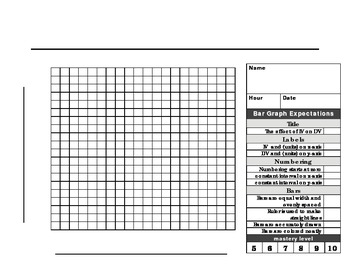
Bar Graph paper and rubric
This 20 X 20 graph paper with rubric is made for a beginner scientist to make a the perfect BAR graph. The checklist format makes it easy for students to know what is expected when graphing. Enjoy!
Subjects:
Grades:
1st - 12th, Higher Education, Adult Education
Types:
Math Project Scatter Plots: Are You Really Going to Eat That? *DISTANCE LEARNING
PRINT and DIGITAL * * Makes distance planning so much easier!Math Project Scatter Plots: Are You Really Going to Eat That? This math project is a fun way for your students to use bivariate data that is highly engaging and relevant to them to construct scatter plots in a real-world situation! Your students will enjoy making choices about restaurants and meals they like to eat based on their personal needs and wishes. Students will organize the nutrition data of the meals they choose using tables
Subjects:
Grades:
7th - 10th, Adult Education
CCSS:
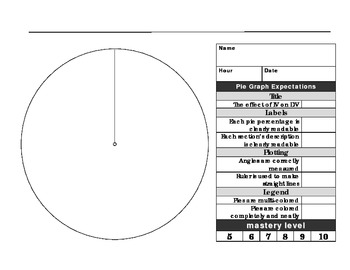
Pie Graph Paper and Rubric
This pie graph paper with rubric is made for a beginner scientist to make a the perfect PIE graph. The checklist format makes it easy for students to know what is expected when graphing. Enjoy!
Subjects:
Grades:
3rd - 12th, Higher Education
Types:
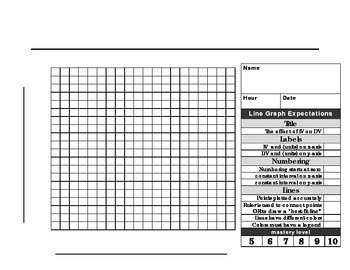
Line graph paper with rubric
This 20 X 20 graph paper with rubric is made for a beginner scientist to make a the perfect LINE graph. The checklist format makes it easy for students to know what is expected when graphing. Enjoy!
Subjects:
Grades:
3rd - 12th, Higher Education
Types:
Showing 1-5 of 5 results


