635 results
Statistics centers for homeschool
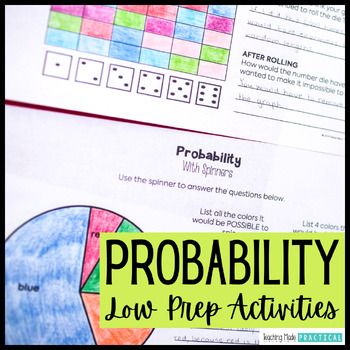
Probability Activities - Fun Review Worksheets, Spinners, Dice, Task Cards
These low prep probability activities and worksheets make a great introduction or review. Students will practice probability vocabulary - certain, impossible, possible, likely, unlikely, and equally likely - and apply these words in a variety of situations and events. Students will also get the opportunity to think about different probability events with hands on practice using spinners, coins, and dice. The fun probability activities include: 6 anchor charts / probability posters to help stu
Subjects:
Grades:
2nd - 5th
Types:
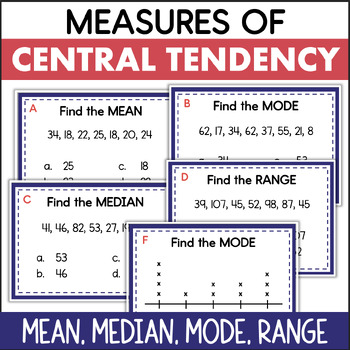
Mean Median Mode Range Measures of Central Tendency Data Task Cards
These data task cards are a great way for students to practice analyzing data to find the mean, median, mode, and range!There are several types of questions, all addressing measures of central tendency. Some require students to interpret a data set of whole numbers. Others involve data presented in a line plot. The last type of question requires the student to choose the correct method for finding the mean, median, mode, or range.This math resource includes:16 task cardsrecording sheetanswer key
Subjects:
Grades:
5th - 7th
Types:
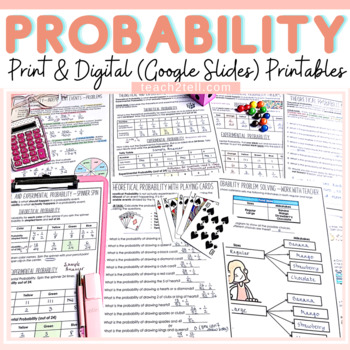
Chance and Probability Activities Print and Digital Worksheets |Google Classroom
Are you teaching your students all about chance and probability and looking for fun hands-on probability activities? This print and digital (google slides) bundle of probability worksheets will reinforce the understanding of theoretical probability, experimental probability, language of chance, sample space, predictions, lists, tree diagrams, dependent probability events and independent probability events.Both US and British English spelling and terminology included.Overview of Activities1. The
Subjects:
Grades:
4th - 8th
Types:
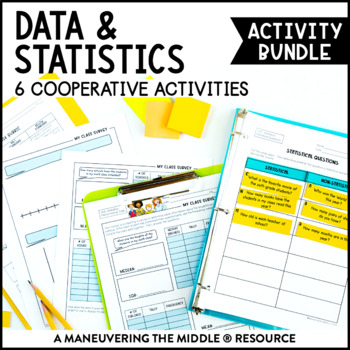
Data & Statistics Activity Bundle | Measures of Center, Histograms, & Box Plots
This Data and Statistics Activity Bundle includes 6 classroom activities to support statistical questions, histograms, box plots, measures of center and measures of variability. These hands-on and engaging activities are all easy to prep! Students are able to practice and apply concepts with these data and statistics activities, while collaborating and having fun! Math can be fun and interactive! Standards: CCSS (6.SP.1, 6.SP.2, 6.SP.3, 6.SP.4, 6.SP.5) and TEKS (6.12A, 6.12B, 6.12C, 6.12D, 6.13
Subjects:
Grades:
5th - 7th
Types:
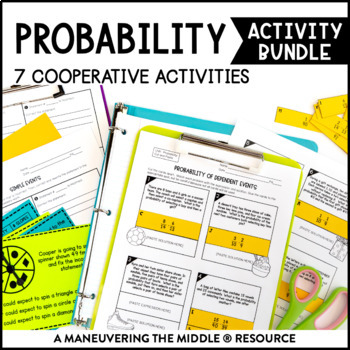
Probability Activity Bundle | Experimental & Theoretical Probability Activities
This Probability Activity Bundle includes 7 classroom activities to determine simple probability, compare experimental and theoretical probability, make predictions, determine independent probability, and find dependent probability. These hands-on and engaging activities are all easy to prep! Students are able to practice and apply concepts with these probability activities, while collaborating and having fun! Math can be fun and interactive!Standards: CCSS (7.SP.5, 7.SP.6, 7.SP.7, 7.SP.8) and
Subjects:
Grades:
7th
Types:
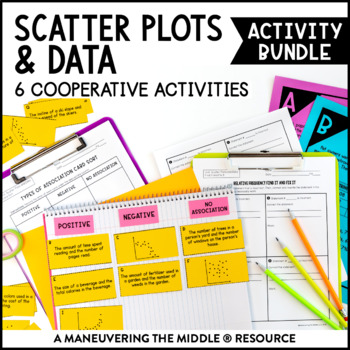
Scatter Plots and Data Activity Bundle | Trend Lines Activities for 8th Grade
This Scatter Plots and Data Activity Bundle includes 6 classroom activities to support 8th grade scatter plots and two-way tables. These hands-on and engaging activities are all easy to prep! Students are able to practice and apply concepts with these scatter plots and two-way table activities, while collaborating and having fun! Math can be fun and interactive!Standards: CCSS (8.SP.1, 8.SP.2, 8.SP.3, 8.SP.4) and TEKS (8.5C, 8.5D, 8.11A)More details on what is included:Six hands-on activities t
Subjects:
Grades:
8th
Types:
Probability Activities MEGA Pack of Math Worksheets and Probability Games
Probability Activities MEGA Pack of Math Worksheets and Probability Games - Over 50 pages of math stations, worksheets, activities, and visuals to teach young learners about probability in fun, hands-on ways!
This packet includes:
- 10 probability vocabulary classroom posters
- 12 various probability worksheets
- 7 hands-on math stations
CHECK OUT THE FREE PREVIEW! Click "Download Preview" under the price :)
This pack is jam-packed! It's really hard to find quality probability worksheets and
Subjects:
Grades:
K - 3rd
Types:
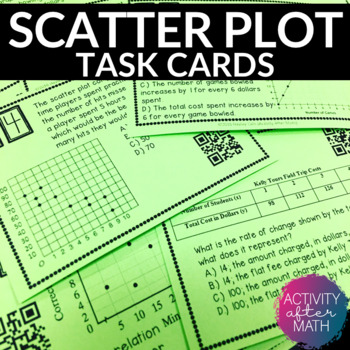
Scatter Plots and Line of Best Fit Task Cards with QR Codes
Get your students involved with practicing Interpreting Data with Scatter Plots and Line of Best Fit! Task cards include multiple choice problems and constructed response. Click here to SAVE and get this as a Task Cards BUNDLEThis resource includes:Teacher InstructionsTeacher TipsStudent Instructions24 Task cards with QR codes24 Task cards without QR codesBlank Answer Document for studentsAnswer Key for easy gradingOptions for using this resource:You can print the ones with QR codes for students
Subjects:
Grades:
8th - 9th
Types:
Also included in: 8th Grade MATH TASK CARDS BUNDLE
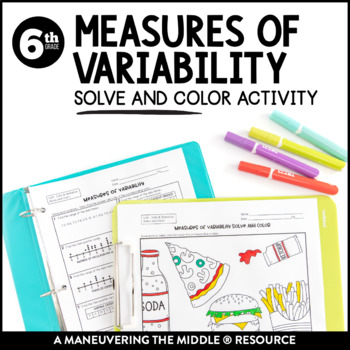
Measures of Variability Coloring Activity | Range & Interquartile Range Activity
This Measures of Variability Solve and Color consists of 8 problems where students will calculate the range or IQR from a data set, dot plot or table. Then, they will locate the answer and color the picture accordingly.This activity is great for in class practice or as a way to spice up independent work! Students can color, while still applying their understanding of measures of variability.Students are able to practice and apply concepts with this measures of variability activity, while collabo
Subjects:
Grades:
5th - 7th
Types:
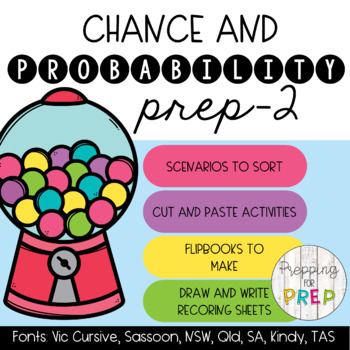
CHANCE AND PROBABILITY (FOUNDATION TO YEAR 2 ACTIVITY PACK)
This activity pack includes a variety of activities for you to use when teaching chance and probability using the language of will happen, might happen, will not happen and likely, unlikely and impossible. The resources include:Chance booklet where students cut along the dotted lines and draw and write about an event that will happen, might happen, will not happen (Or likely, unlikely, impossible). There are 7 font options and 1 with dotted thirds and one plain without lines to select from. What
Subjects:
Grades:
PreK - 4th
Types:
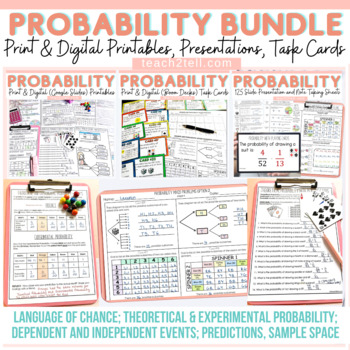
Chance and Probability Activities Theoretical & Experimental Probability Bundle
Are you teaching your students all about chance and probability and looking for fun hands-on probability activities? This print and digital bundle of worksheets, task cards, slideshows and note-taking sheets on Probability will reinforce the understanding of theoretical probability, experimental probability, language of chance, sample space, predictions, lists, tree diagrams, dependent probability events and independent probability events.Both US and British English spelling and terminology file
Subjects:
Grades:
4th - 7th
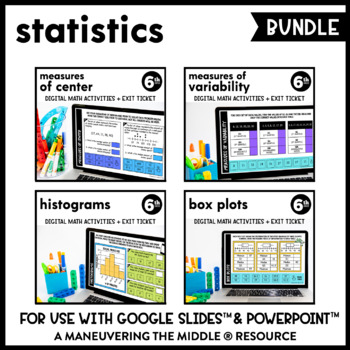
Statistics Digital Math Activity Bundle | Measures of Center | Google Slides
These supplemental digital math activities can be used to support data and statistics concepts. They are interactive (drag and match, using the typing tool, using the shape tool) and paperless through Google Slides™ and PowerPoint™. Topics Included:Measures of Center (4 interactive slides + exit ticket)Measures of Variability (4 interactive slides + exit ticket)Histograms (4 interactive slides + exit ticket)Box Plots (4 interactive slides + exit ticket)What is included?1. Paperless Math Activit
Subjects:
Grades:
6th
Types:
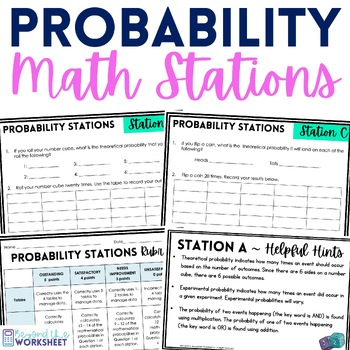
Probability Math Stations | Math Centers
⭐️⭐️ This set of math stations allow students to take a cooperative and hands on approach to learning about probability. Students compare the theoretical probability to their actual experimental results. ⭐️⭐️ A rubric is included, as well as the printables you need for each station (color cards, letter cards and the cuboctrohedron net). Also included are hint cards. You can decide whether or not you give the hint cards to students as they work through the stations. You simply need to provide coi
Subjects:
Grades:
6th - 10th
Types:
Also included in: 7th Grade Math Curriculum Supplemental Activities Bundle
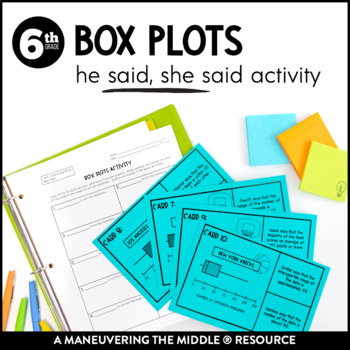
Box Plots Error Analysis | Measures of Center & Variability Box Plot Activity
This Box Plots He Said, She Said Activity consists of 10 cards where students must analyze errors and justify their responses. This activity focuses on box plots and their measure of center and variability. This activity works best in a collaborative setting where students will use mathematical discourse to discuss and defend their responses. An excellent way to incorporate higher level thinking skills! Students are able to practice and apply concepts with this box plots activity, while collabo
Subjects:
Grades:
5th - 7th
Types:
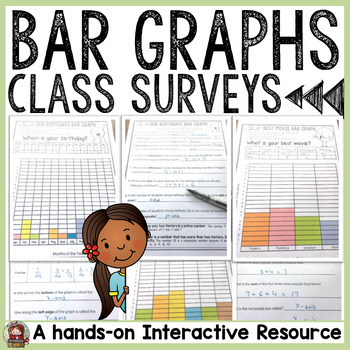
BAR GRAPHS: CLASS SURVEYS ACTIVITIES
BAR GRAPHS: SURVEYSThis Bar Graphs Class Surveys collection features collecting, graphing and interpreting data on topics your students will relate to. This is perfect for a getting-to-know-you back to school activity, or alternatively for applying graphing skills in real life situations.⭐ Separate folders featuring both British English and American spellings and terminology included.►What’s Included✅ 12 Class Surveys on topics of interest.✅ Choice of three Cover Sheets if compiling student su
Subjects:
Grades:
3rd - 6th
Types:
CCSS:
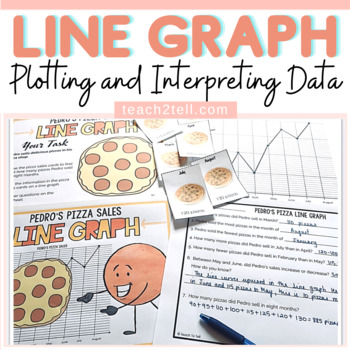
Line Graph Activity | Plotting and Interpreting Data on a Line Graph
Looking for a line graph activity that involves plotting and interpreting data on a line graph? Your students will enjoy this hands-on center activity that involves recording pizza sales over a given period using card visuals. They will get to plot and interpret data on a line graph.Items IncludedFile folder cover (2 options): if placing all items in a file at a centerSingle large task card (color and blackline) on a sheet outlining the taskTwo small task cards (color and blackline) on a sheet o
Subjects:
Grades:
2nd - 5th
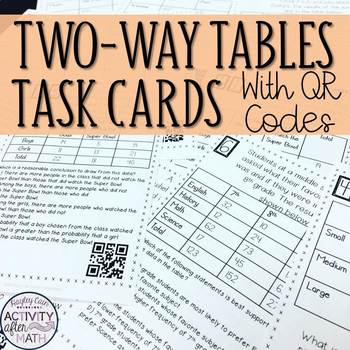
Two-Way Tables (Interpreting Data) Task Cards with QR Codes
Get your students involved with practicing Interpreting Data with Two-Way Tables! This is a great activity that can be used in Math Centers, as individual work, or as a group activity! This gets students moving and also integrates the use of technology into the classroom by scanning QR Codes to check your answer to get immediate feedback!Click here to SAVE and get this as a Task Cards BUNDLEThis resource includes:Teacher InstructionsStudent Instructions20 Task cards with QR codes20 Task cards wi
Subjects:
Grades:
8th - 9th
Types:
CCSS:
Also included in: 8th Grade MATH TASK CARDS BUNDLE
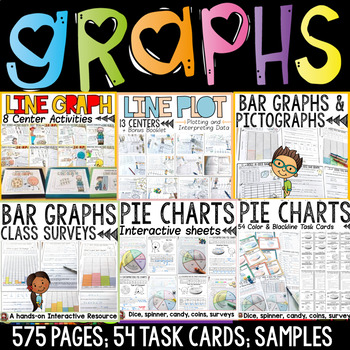
Bar Graphs Pictographs Line Graphs Line Plots Pie Charts Data Collection Bundle
The graphing bundle features interactive activities for creating and interpreting bar graphs, pictographs, line graphs, line plots and pie charts. Your entire graphing unit for a year!Separate folders featuring both British English and US spellings and terminology included.Great quality and value for this whopping 575 + page unit on graphing! Data is collected and interpreted using concrete materials such as visuals, dice, spinners, coins and other real-life objects and contexts. Further details
Subjects:
Grades:
2nd - 6th
Types:
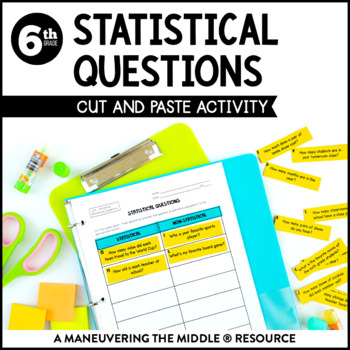
Statistical Questions Activity | Summarizing Categorical Data Activity
This Statistical Questions Cut and Paste is a great for practicing identifying what is and isn't considered a statistical question. Students will determine whether each question provided is statistical or non-statistical and paste them in the appropriate column. This activity is great for extra practice, as a station or center, and can be used to add variety to homework or independent work. Students can be hands-on, while still applying their understanding of statistical questions. Students ar
Subjects:
Grades:
5th - 7th
Types:
CCSS:
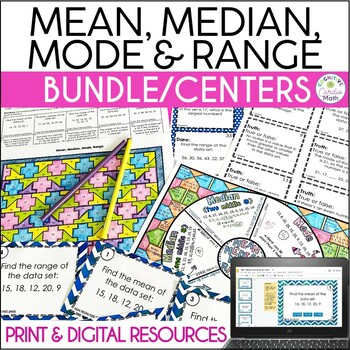
Mean, Median, Mode, Range Activity Bundle Math Centers
Use these mean, median, mode and range resources for your upper elementary or middle school math centers, homework, or independent practice! Some print and some digital.There are both group and independent activities to keep your students active and engaged.The resources include Truth or Dare game, Color by Number, Footloose Task Cards, and Math Wheel for taking notes.In these mean, median, mode, range resources, problems require students to:Find mean, median, mode or range of data setsFind a mi
Subjects:
Grades:
5th - 6th
Types:
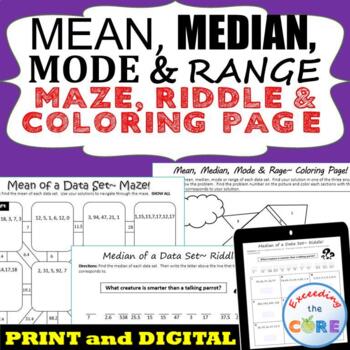
MEAN, MEDIAN, MODE, & RANGE Mazes, Riddles & Coloring Page | Print and Digital
Have your students apply their understanding of finding the MEAN, MEDIAN, MODE, & RANGE of data sets with these fun activities including a maze, riddle and coloring activity. What is Included:1. Finding the Mean MAZEThis is a self-checking worksheet that allows students to strengthen their understanding of finding the mean of positive whole numbers. Students use their answers to navigate through the puzzle.2. Finding the Median RIDDLEStudents find the median of positive whole numbers and use
Subjects:
Grades:
5th - 7th
Types:
Also included in: 6th Grade Math Assessments, Notes, Task Cards, Worksheets BUNDLE
Sweets Probability Activities (chocolate, candy, M&Ms, Skittles, Kisses)
Uses chocolates or candy (M&Ms, Skittles, Kisses) to practice probability!
What's included-
*Colored candy probability activity: have students randomly pick colored candy and tally what's picked to experiment probability
*Colored candy probability activity reflection page- have students reflect on the experiment and explain their thinking
*M&M's probability activity: have students figure out how many M&M's are in a bag and what color of each by using probability
*M&M's probabil
Subjects:
Grades:
2nd - 8th
Types:
Also included in: Probability Activity BUNDLE
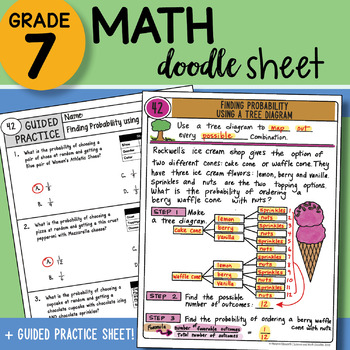
Math Doodle - Finding Probability using a Tree Diagram - Easy to Use Notes w PPT
7th Grade Math Doodle Sheet Product INCLUDES:Math Doodle Sheet - blank and keyGuided Practice Sheet - blank and keyPowerPoint – to show students the KEY– two versions of both sheets included: INB and large 8.5 x 11 size ALL TEKS Aligned– plan for the FULL year included with table of contents page for INB! SAVE BIG and buy the WHOLE YEAR SET found here:7th Grade Math Doodle Sheets ALL YEAR SET WHOLE YEAR SET List below:ALL TEKS Aligned– plan for the FULL year included! LIST of 88 Doodle Sheets p
Subjects:
Grades:
6th - 8th
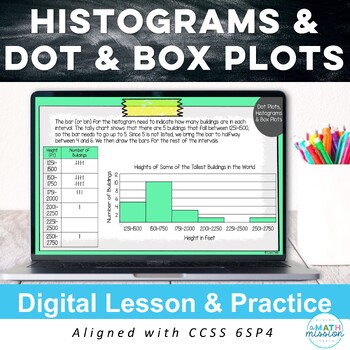
Statistics Histograms Box Plots Dot Plots Digital Math Lesson 6SP4 Activity
Save yourself time with this editable, digital math resource! Included is the lesson and practice for displaying numerical data on histograms, box and whisker plots, and dot plots. This digital activity guides students through the 6.SP.4 standard. Informational lesson pages are intertwined with interactive learning activity slides. Students drag or type in answers on the Google Slides. Great alternative to worksheets! These can be used in so many ways: math centers, stations, extra practice, as
Subjects:
Grades:
6th - 7th
CCSS:
Showing 1-24 of 635 results


