91 results
Statistics rubrics for parents
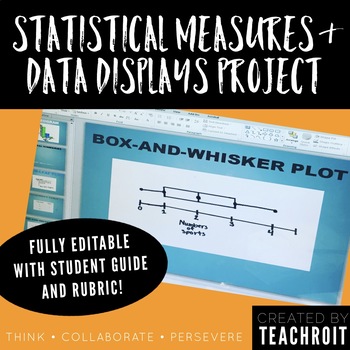
Statistics & Data Display Project for 6th Grade Math PBL (Fully Editable)
This product includes a student guide for a 6th grade middle school mathematics project that will require students to develop a statistical question, conduct a survey with their classmates, create numerical summaries, represent their findings using visual data displays, and finally present their findings! The thorough student guide provides step by step directions for each part of the project and could be used as either an in class project or to be assigned as homework. The student guide also in
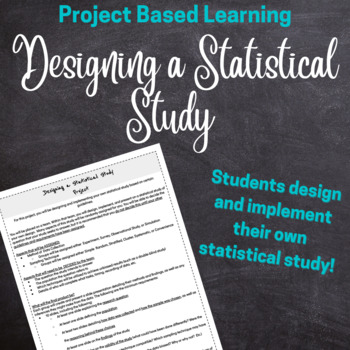
Statistics Project Design and Implement a Statistical Research Study Project
Prove that your students know how a good statistical or research study is designed! In this project, students will be assigned a method of data collection (either Observational Study, Experiment, Survey, or Simulation) and a sampling technique (either cluster, stratified, simple random, systemic, or convenience) and will design their own research question and study. The goal is for students to develop a research question that works well with the method of collection and sampling technique they w
Subjects:
Grades:
11th - 12th, Higher Education, Adult Education
Types:
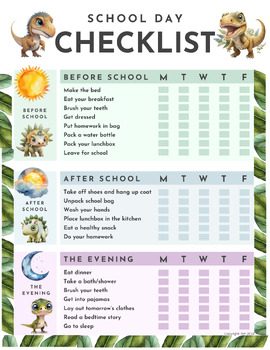
School Day Checklist
✏️ Get ready to ace every school day with our ultimate School Day Checklist – now on sale! Say goodbye to frantic mornings and hello to smooth sailing with our comprehensive checklist designed to streamline your child's routine. Whether you're a teacher, or parent, this checklist is your secret weapon for success! Grab yours now and make every school day a breeze!
Subjects:
Grades:
Not Grade Specific
Project. Misleading Graphs Analysis Write Up with Rubric
Students will watch the TEDTalk How to spot a misleading graph - Lea Gaslowitz then do some research to find misleading graphs in the media!Objective. Students will research TWO misleading graphs, then create a google doc with those graphs and provide a written analysis. This is an individual assignment. Opportunity to explain...- Cherry Picking- Vertical axis manipulation- Horiztonal axis proportion- the author's motivation to graphically manipulate dataRubric is provided.
Subjects:
Grades:
8th - 12th
Middle School Survey Statistics Project Bundle
DescriptionA bundle of all materials needed for my Middle School Survey Project! Perfect for an end of year or statistics unit project.A fun, engaging, and active way for students to explore the foundations of statistical analysis and modeling.In this project students are tasked with creating a statistical question, surveying two relevant populations, calculating the measures of center and variability, making a dot plot, histogram, and box-and-whisker plot, and analyzing their data.Included in t
Subjects:
Grades:
6th - 9th
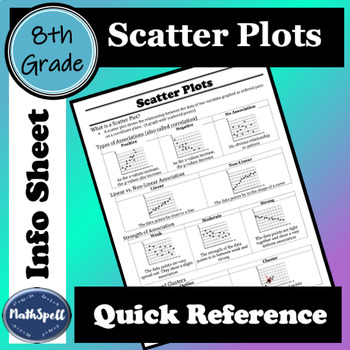
Scatter Plots and Correlation/Association | 8th Grade Math Quick Reference Sheet
This 8th Grade Math Quick Reference Sheet defines what a scatter plot is. Two sheets are provided to give you the option to use the term correlation or the term association. It shows examples for positive, negative, and no association/correlation and explains what each type means. Examples are given for linear and non-linear association/correlation, different strengths (weak, moderate, and strong) as well as what outliers and clusters are.This info sheet can be used for students to review scatte
Subjects:
Grades:
8th - 9th
Types:
CCSS:
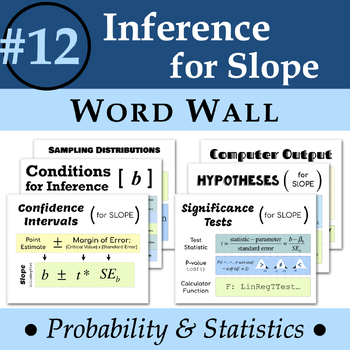
Statistics Word Wall #12: Inference for Slope
Statistics Word Wall #12: Inference for SlopeHelp your statistics students remember essential concepts and vocabulary with a visual word wall! Included are 6 letter-sized thematic posters that encompass over 12 terms! These terms align with Chapter 12 of TPS. TERMSSampling distributions of slope10% conditionNormality conditionConditions for inferenceConfidence intervals for slopeNull & alternative hypotheses for slopeSignificance tests for slopeTest statistic for slopeStandard error for slop
Subjects:
Grades:
9th - 12th
Also included in: Statistic Word Wall BUNDLE
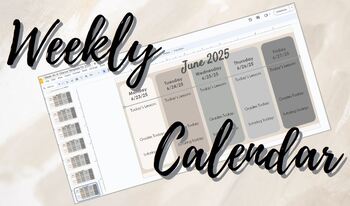
Weekly Calendar for 24-25 School Year (August-June)
Does your school require you to have a week-at-a-glance posted for students and parents? Mine does, so I try to make it fit my personality and have some fun with it. This template has all weeks from August 5, 2024-June 27, 2025 - once you buy, you can delete weeks you do not need. Table rows are formatted to keep your writing lined up with the sections in the background. Rows are "Today's Lesson," "Grades Today," and "Tutoring." Feel free to change them to match your needs.:) Happy Teaching
Subjects:
Grades:
Not Grade Specific
Statistical Question Survey Project
Students will be creating their own statistical questions to survey students in their grade (or school if you have a small school), the sample, and make an inference about all of the students in their grade(or school), the population. This would be great to either go along with the unit, right after, or at the end of the year for a review project. See the preview of what a project could look like for a student.Page with description, materials needed, and directionsStudent pagesSample student pag
Subjects:
Grades:
6th - 10th
Types:
Also included in: Statistics Activities Bundle
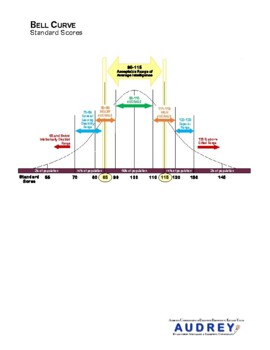
Special Education Evaluation Bell Curve SpEd Evaluation Diagnostician
Graphic to help explain standard scores to parents. See my other listings with the full version that contains information for parents.
Subjects:
Grades:
Not Grade Specific
Types:
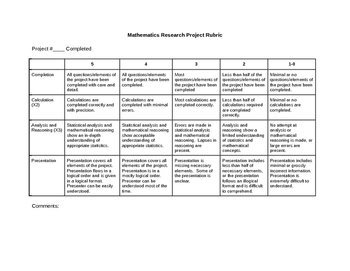
Math or Statistics Research Project Rubric
This editable rubric contains fields for project completion, calculation, analysis and reasoning, and presentation on a scale of five to one. It was originally designed for the Alberta Math 20-2 mathematics research project requirement, but is suitable for use across junior and senior high.
Subjects:
Grades:
9th - 11th

Probability for grades 6-10
This packet will guide you into putting on a school wide carnival with games of chance. I have been doing this for 15 years and it is always a success. The Rubric for the final project is included along with experiments.
Subjects:
Grades:
6th - 10th
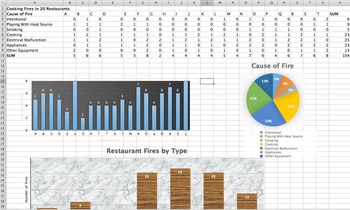
Statistics Project Unit 3 Spreadsheets Mean Median Mode Std. Deviation (2 day)
This is a 1-2 day project aimed at introducing a statistics class to Excel (or Numbers) who are familiar with Pie Charts, Bar Charts, Measures of Central Tendency, and Standard Deviation. The students will input data (included) into Excel (on fires in restaurants), form their own Bar Charts and Pie Charts, and be able to input formulas into the Excel to automatically calculate statistics. Students will be given the opportunity to explore different charts and design their charts to make them colo
Subjects:
Grades:
9th - 12th, Higher Education, Adult Education
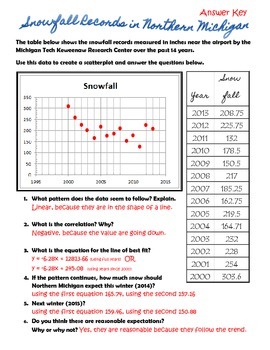
Scatter Plot Prediction Worksheet Answer Key
This is the answer key to my free download!
Subjects:
Grades:
9th - 12th
Types:
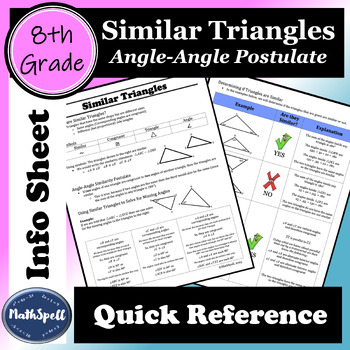
Similar Triangles | Angle-Angle Postulate | 8th Grade Math Quick Reference Sheet
This 8th Grade Math Quick Reference Sheet Defines what similar triangles areShows symbols for similar, congruent, triangle, and angleUses symbols to write similarity statementsExplains the angle-angle similarity postulate Describes how to use similar triangles to solve for missing angles in a triangleShows examples for determining if triangles are similar (includes an example that uses parallel lines cut by a transversal)The second page is available in color as well as black and white.This info
Subjects:
Grades:
8th - 9th
Types:
CCSS:
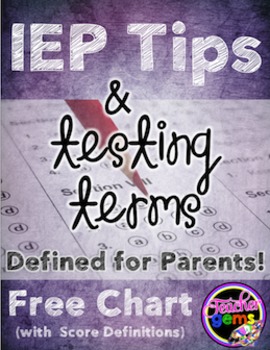
IEP Tips and Testing Terms Defined - Free Chart
IEP Tips and Testing Terms Defined for Parents Free Chart: This freebie includes a page of tips for running a successful IEP meeting and another page that is a chart with the normal bell curve that defines different types of test scores. The scores defined are standard scores, stanines, percentile ranks, standard deviation, grade equivalents, age equivalents and composite scores. If you’d like to create your own chart like this check out my normal bell curve clipart package here!
You might al
Grades:
Staff
Analyzing Misleading Graphs
Students are to find a graph online. They are given a url and other resources on how to find it. From there, they are to write a paragraph analyzing the validity of the graph. They are to include the title, resource, what the article is trying to convey, how it is/is not misleading, and at least two suggestions on how to make the graph more clear. Since this is a web-based assignment, it would be perfect for distance learning. Included:Student directions (in word doc so editable for your classro
Subjects:
Grades:
7th - 12th
Types:
CCSS:
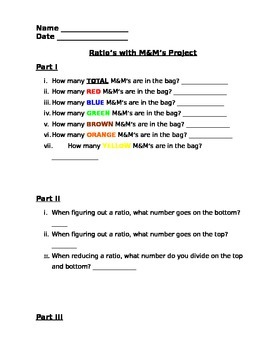
Ratios with M&M's Project
This is a quick assessment to help students figure out the ratios of M&M's in a bag. You provide the candy and I provide the worksheet. Students will be requested to open the bag, count all candies and than follow the directions marking ratios for each listed color.
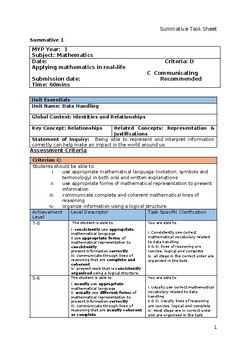
MYP-1_Data Handling_Criterion-C_D
This word document can be used as Summative/Formative assessment based on the topic Data Handling including topics- finding sector angle, constructing pie-charts, drawing dual bar-chart and writing conclusion on your infographics, what is the relationship between life expectancy and access to safe water? In your opinion, what can be done to improve access to safe water and increase life expectancy in countries with limited access to safe water? Explain your answer.It includes task specific des
Subjects:
Grades:
6th - 7th
Types:
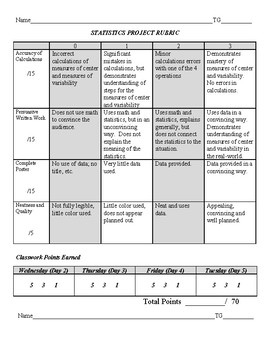
Analyzing Data: A Real World Statistics Project
This statistics project asks students to display their understanding of measures of center and measures of variability in a real life situation. Students must calculate the measures of center and variability and create a data driven argument for installing a speed bump outside of their school. This package consists of a rubric, a project and product overview, a student checklist, partner choice handout and a brief handout for an alternative project.
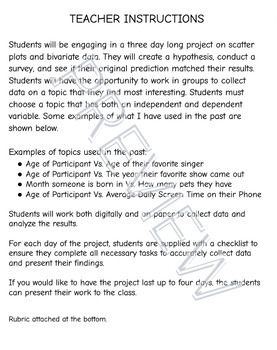
Scatter Plot and Bivariate Data Project
Students will be engaging in a three day long project on scatter plots and bivariate data. They will create a hypothesis, conduct a survey, and see if their original prediction matched their results. Students will have the opportunity to work in groups to collect data on a topic that they find most interesting. Rubric attached at the bottom.
Subjects:
Grades:
6th - 12th
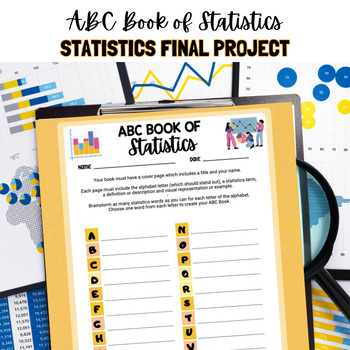
ABC Book of Statistics
Looking for a Cumulative Project for Your Statistics Class?This ABC Book gives students an opportunity to search and review statistics terminology from throughout the course. Students use the brainstorm sheet to write down statistics vocabulary words for each letter of the alphabet. Students will then create an ABC book. A sample page is provided (Z is for Z-Score!) A 15 point rubric is also included for this Statistics Project!
Subjects:
Grades:
9th - 12th
Types:
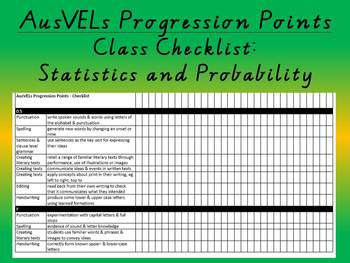
Statistics and Probability - AusVELs Progression Points - Class Checklist
AusVELs progression points for Statistics and Probability presented in a class checklist for primary levels. Great assessment tracker tool.
Subjects:
Grades:
K - 6th
Types:
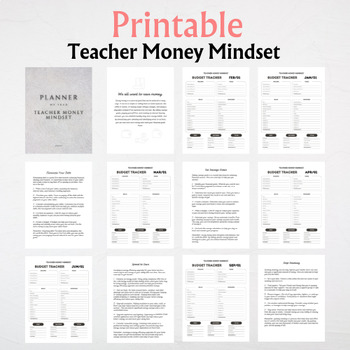
Teacher Money Mindset - Monthly Budget Tracker - 10 Best Ways to Save Money
Keep track of income & save for tomorrow with 12 month tracking sheets, and 10 Best Ways to Save Money with TEACHER MONEY MINDSET PRINTABLEIt's great to hear that there is a resource available to help teachers keep track of their income and expenses. Managing money can be challenging, and having a budget template can be a useful tool to help individuals stay organized and plan for the future. It's important for everyone, including teachers, to prioritize saving and planning for their financi
Subjects:
Grades:
Not Grade Specific
Showing 1-24 of 91 results


