83 results
Statistics outlines for homeschool
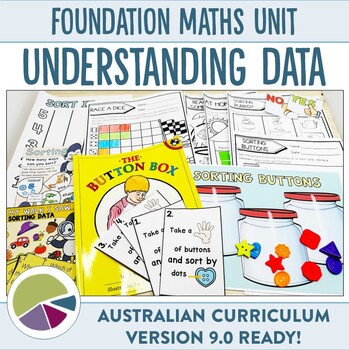
Australian Curriculum 9.0 Foundation Maths Unit Data
Help your students explore the use of data with this unit plan and activity bundle. Bring your maths lessons to life as the unit plan walks you through everything you need to thoroughly cover the AC9MFST01 element of the Australian Foundation Maths curriculum (version 9.0). Fun for students, easy for you to implement and an irresistible way to help budding mathematicians collect, sort and compare data!Bring the fun back into learning about data as you guide your students through the following Au
Subjects:
Grades:
PreK - 1st
Types:
Also included in: Ultimate Australian Curriculum 9.0 Foundation Units Bundle
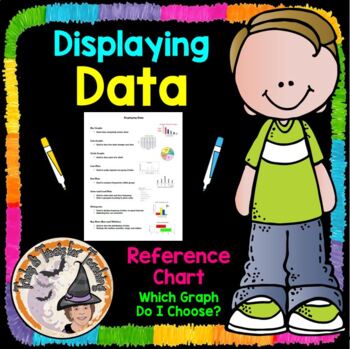
Displaying Data Reference Chart Notes Which Graph Do I Choose?
Math Teachers ~ You'll LOVE this Displaying-Data, Which-Graph-Do-I-Choose? Data-Display Reference-Chart will be SUPER helpful to your students in helping them determine which graph to choose, and provides a quick visual picture to remind them what that particular graph looks like. I printed one of these for each of my students to put inside their Math Toolkit Notebook, to use as a Reference for Data Displays Charts and Graphs. You'll enjoy using this year after year!Be sure to L@@K at my other 1
Subjects:
Grades:
5th - 8th
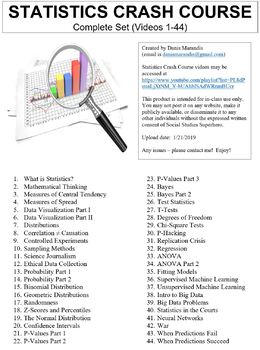
Crash Course Statistics Worksheets Complete Series Set Full Bundle Collection
This ZIP file contains Microsoft Word document worksheets (along with PDF versions) for each of the forty-four episodes of Crash Course Statistics hosted by Adriene Hill.Worksheets contain a combination of fill-in-the-blank and short answer questions. Each worksheet is accompanied with an answer key and relevant images.By purchasing this file, you agree not to make it publicly available (on external websites, etc.) or to share with any other teachers. It is intended for classroom use only. You *
Subjects:
Grades:
9th - 12th, Higher Education, Adult Education, Staff
Types:
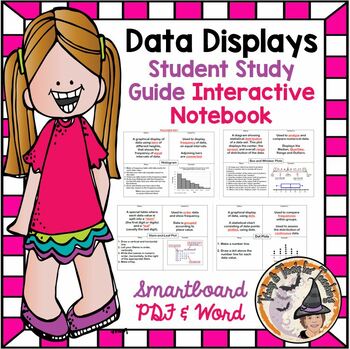
Data Displays Interactive Notes Stem Leaf Box Whiskers Histogram Dot Plots
Teachers ~ You'll LOVE these Interactive Notes that covers the following 4 data displays; Stem and Leaf Plot, Box and Whisker Plot, Histogram, and Dot Plot. The zipfile contains the Teacher's KEY version along with the Student's Fill in the Blank outline for Note Taking. You get BOTH the Students' Notes and the Teacher's KEY in both Word and Pdf formats for easy printing, along with Smartboard slides of everything as well. You'll LOVE using this year after year! Be sure to L@@K at my other 1,285
Subjects:
Grades:
5th - 7th, Staff
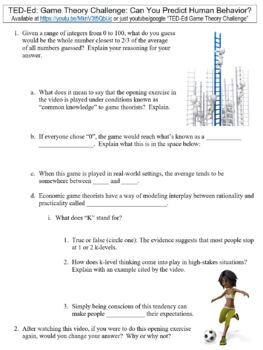
TED-Ed worksheet: Game Theory Challenge: Can You Predict Human Behavior?
This is a zip file that contains a Microsoft Word worksheet (along with a PDF version) to accompany the TED-Ed video for "Game Theory Challenge: Can You Predict Human Behavior?". Answer key is included as well.By purchasing this file, you agree not to distribute it to other non-students. It is intended for classroom use only, but may be used for distance learning as well as long as it is not made available outside of your students.=====Interested in Crash Course worksheet bundles?ALL Crash Cour
Subjects:
Grades:
9th - 12th, Higher Education, Adult Education, Staff
Types:
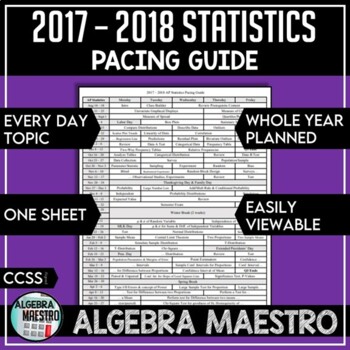
2017-2018 AP Statistics Pacing Guide
With 2017-2018 AP Statistics Pacing Guide, your planning for the year is done! I've taken the standards and learning targets for AP Statistics and organized it for the year. It is one-sheet that is organized and user-friendly. You will know what to teach each day and know what topics are coming up. Non-teaching days are taken into account, such as testing, staff development days, etc. I hope that this helps you in your planning!Please review if you purchase! Thank you!Other 2017-2018 Mathematics
Subjects:
Grades:
9th - 12th, Higher Education, Adult Education, Staff
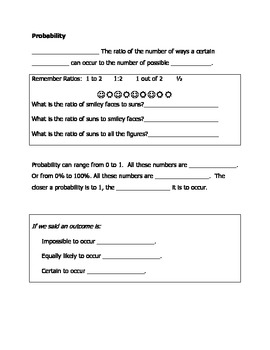
Interactive Notebook Probability Guided Notes: Theoretical vs Experimental
Guided notes discussing the concepts of Probability as a ratio, fraction, and percent. Further discussion compares Theoretical and Experimental Proability, the definitions, and forumulas to calculate. For 5th - 8th grade general education or special education classrooms. Great for your interactive notebooks.
Subjects:
Grades:
4th - 9th
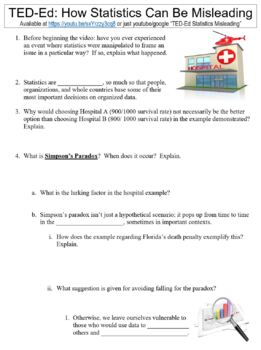
TED-Ed worksheet: How Statistics Can Be Misleading
This is a zip file that contains a Microsoft Word worksheet (along with a PDF version) to accompany the TED-Ed video for "How Statistics Can Be Misleading". Answer key is included as well.By purchasing this file, you agree not to distribute it to other non-students. It is intended for classroom use only, but may be used for distance learning as well as long as it is not made available outside of your students.=====Interested in Crash Course worksheet bundles?ALL Crash Course Videos (1400+ Works
Subjects:
Grades:
9th - 12th, Higher Education, Adult Education, Staff
Types:
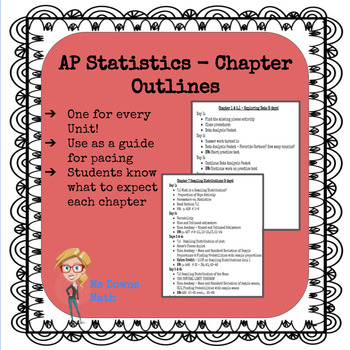
AP Statistics Chapter Outlines
When I first started teaching AP Statistics, one of the hardest things was figuring out the pacing of the course in order to complete everything and still have time to review for the exam!I use The Practice of Statistics 5th Edition and have created unit outlines that I give to the students at the beginning of each unit. The outlines show how many days are spent on the topic and the homework assignments for each day. It is a mini syllabus for each unit. This download includes an outline for each
Subjects:
Grades:
9th - 12th
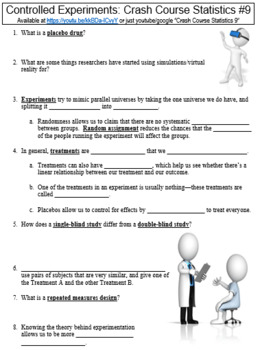
Crash Course Statistics #9 (Controlled Experiments) worksheet
This is a zip file that contains a Microsoft Word worksheet (along with a PDF version) to accompany the crash course video for Statistics #9. Answer key is included as well.By purchasing this file, you agree not to make it publicly available (on websites, etc.) or to share with any other teachers. It is intended for classroom use only. You may, however, post it on learning management systems such as Google Classroom as long as the file is only accessible to students and not to any outside source
Subjects:
Grades:
9th - 12th, Higher Education, Adult Education, Staff
Types:
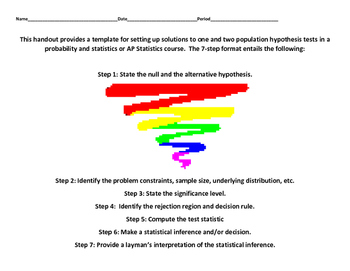
Hypothesis Testing Template
This handout provides a template for setting up solutions (using the classical approach) to one and two population hypothesis tests in a probability and statistics or AP Statistics course. The 7-step format entails the following:
Step 1: State the null and the alternative hypothesis.
Step 2: Identify the problem constraints, sample size, underlying distribution, etc.
Step 3: State the significance level.
Step 4: Identify the rejection region and decision rule.
Step 5: Compute the test statist
Subjects:
Grades:
9th - 12th
Types:
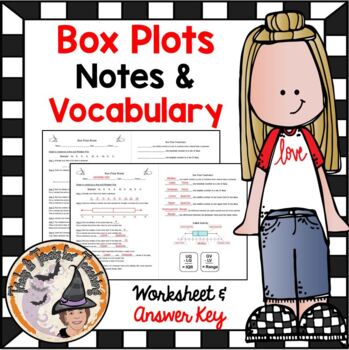
Box and Whisker Plots Notes and Practice Worksheet with Answer Key
Math Teachers ~ You'll love this AMAZING Box-and-Whisker-Plots-Notes-and-Practice, 2 page pdf where students take notes and practice creating and labeling a Box-Plot. The Zipfile contains the 2 page pdf printable worksheet and the 2 page Answer KEY. You'll LOVE using this year after year to introduce and practice Box Plots. This can be used as a Guided Practice, Math Station, Homework, or Independent Work. Answer KEY included. Learn to love teaching this skill with this terrific resource that st
Subjects:
Grades:
6th - 7th
Also included in: Box & Whisker Plots Smartboard Slides Notes Worksheet BUNDLE
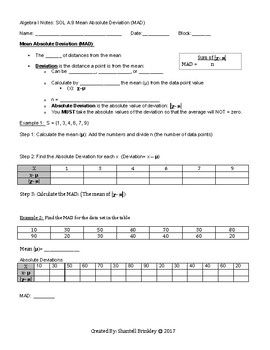
Mean Absolute Deviation (MAD) Notes
This 1 page cloze note sheet will guide students through understanding what the Mean Absolute Value is. Students will also have the opportunity to calculate the Mean Absolute Deviation for 2 sets of data points by hand. An answer key is also provided.
You are purchasing access for 1 teacher as a classroom set. The document is not to me shared with others or posted on any online venue at any time. For multiple teachers in a school please purchase the number of licenses required for a discounted
Subjects:
Grades:
6th - 12th, Higher Education, Adult Education
CCSS:
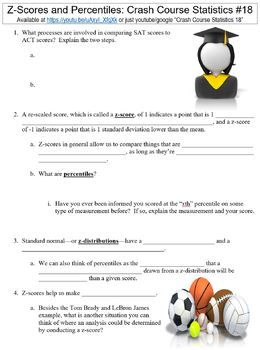
Crash Course Statistics #18 (Z-Scores and Percentiles) worksheet
This is a zip file that contains a Microsoft Word worksheet (along with a PDF version) to accompany the crash course video for Statistics #18. Answer key is included as well.By purchasing this file, you agree not to make it publicly available (on websites, etc.) or to share with any other teachers. It is intended for classroom use only. You may, however, post it on learning management systems such as Google Classroom as long as the file is only accessible to students and not to any outside sourc
Subjects:
Grades:
9th - 12th, Higher Education, Adult Education, Staff
Types:
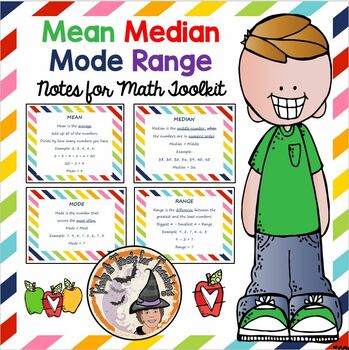
Mean Median Mode Range Notes Central Tendency Measures of Center
This Zipfile includes LOTS of goodies! You get a colorful background border notes for students for Measures of Center, Central Tendency; Mean-Median-Mode-and-Range, in 3 different sizes! The 3 pdf files are different sizes (full page sheets, half page sheets, and mini size 4 to a sheet). This allows for printing for students' Math Toolkits in whatever size you'd like. You also get a Smartboard slides of the 4 pages of colorful Notes, along with the original (4 pages) Word Document and PDF versio
Subjects:
Grades:
5th - 8th
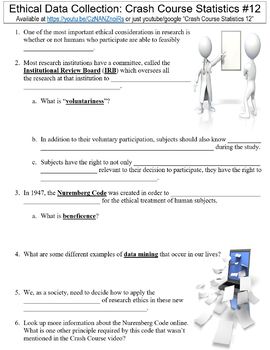
Crash Course Statistics #12 (Ethical Data Collection) worksheet
This is a zip file that contains a Microsoft Word worksheet (along with a PDF version) to accompany the crash course video for Statistics #12. Answer key is included as well.By purchasing this file, you agree not to make it publicly available (on websites, etc.) or to share with any other teachers. It is intended for classroom use only. You may, however, post it on learning management systems such as Google Classroom as long as the file is only accessible to students and not to any outside sourc
Subjects:
Grades:
9th - 12th, Higher Education, Adult Education, Staff
Types:
Crash Course Statistics #10 (Sampling Methods) worksheet
This is a zip file that contains a Microsoft Word worksheet (along with a PDF version) to accompany the crash course video for Statistics #10. Answer key is included as well.By purchasing this file, you agree not to make it publicly available (on websites, etc.) or to share with any other teachers. It is intended for classroom use only. You may, however, post it on learning management systems such as Google Classroom as long as the file is only accessible to students and not to any outside sourc
Subjects:
Grades:
9th - 12th, Higher Education, Adult Education, Staff
Types:
Crash Course Statistics #5 (Data Visualization, Part I) worksheet
This is a zip file that contains a Microsoft Word worksheet (along with a PDF version) to accompany the crash course video for Statistics #5. Answer key is included as well.By purchasing this file, you agree not to make it publicly available (on websites, etc.) or to share with any other teachers. It is intended for classroom use only. You may, however, post it on learning management systems such as Google Classroom as long as the file is only accessible to students and not to any outside source
Subjects:
Grades:
9th - 12th, Higher Education, Adult Education, Staff
Types:
TED-Ed worksheet: How Good Are You at Calculating Risk?
This is a zip file that contains a Microsoft Word worksheet (along with a PDF version) to accompany the TED-Ed video for "How Good Are You at Calculating Risk?". Answer key is included as well.By purchasing this file, you agree not to distribute it to other non-students. It is intended for classroom use only, but may be used for distance learning as well as long as it is not made available outside of your students.=====Interested in a 125-worksheet bundle for Psychology TED-Ed videos?=====Inter
Subjects:
Grades:
9th - 12th, Higher Education, Adult Education, Staff
Types:
Crash Course Statistics #8 (Correlation ≠ Causation) worksheet
This is a zip file that contains a Microsoft Word worksheet (along with a PDF version) to accompany the crash course video for Statistics #8. Answer key is included as well.By purchasing this file, you agree not to make it publicly available (on websites, etc.) or to share with any other teachers. It is intended for classroom use only. You may, however, post it on learning management systems such as Google Classroom as long as the file is only accessible to students and not to any outside source
Subjects:
Grades:
9th - 12th, Higher Education, Adult Education, Staff
Types:
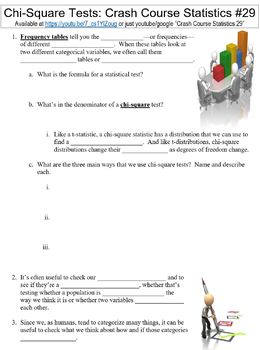
Crash Course Statistics #29 (Chi-Square Tests) worksheet
This is a zip file that contains a Microsoft Word worksheet (along with a PDF version) to accompany the crash course video for Statistics #29. Answer key is included as well.By purchasing this file, you agree not to make it publicly available (on websites, etc.) or to share with any other teachers. It is intended for classroom use only. You may, however, post it on learning management systems such as Google Classroom as long as the file is only accessible to students and not to any outside sourc
Subjects:
Grades:
9th - 12th, Higher Education, Adult Education, Staff
Types:
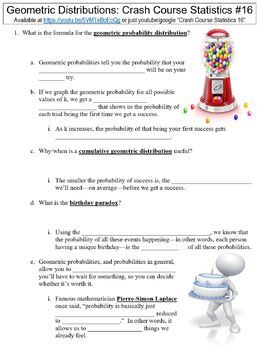
Crash Course Statistics #16 (Geometric Distributions) worksheet
This is a zip file that contains a Microsoft Word worksheet (along with a PDF version) to accompany the crash course video for Statistics #16. Answer key is included as well.By purchasing this file, you agree not to make it publicly available (on websites, etc.) or to share with any other teachers. It is intended for classroom use only. You may, however, post it on learning management systems such as Google Classroom as long as the file is only accessible to students and not to any outside sourc
Subjects:
Grades:
9th - 12th, Higher Education, Adult Education, Staff
Types:
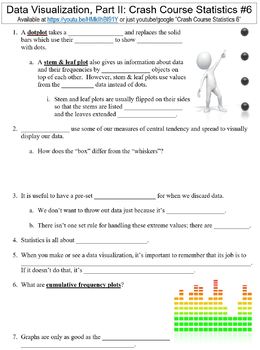
Crash Course Statistics #6 (Data Visualization, Part II) worksheet
This is a zip file that contains a Microsoft Word worksheet (along with a PDF version) to accompany the crash course video for Statistics #6. Answer key is included as well.By purchasing this file, you agree not to make it publicly available (on websites, etc.) or to share with any other teachers. It is intended for classroom use only. You may, however, post it on learning management systems such as Google Classroom as long as the file is only accessible to students and not to any outside source
Subjects:
Grades:
9th - 12th, Higher Education, Adult Education, Staff
Types:
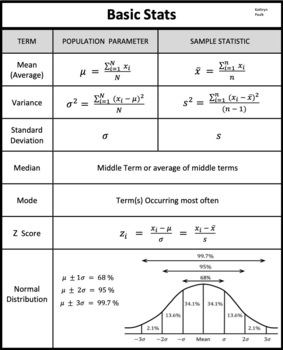
Basic Statistics (JPG)
Basic Statistics, Population and Sample Parameters, Mean, Median, Mode, Variance, Standard Deviation, Normal Distribution.
Subjects:
Grades:
6th - 12th, Adult Education
Types:
Showing 1-24 of 83 results


