343 results
Common Core HSS-ID.A.1 pdfs
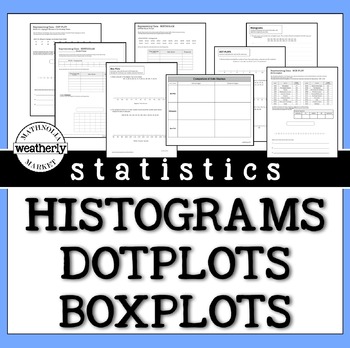
STATISTICS - Histograms, Dot Plots and Box Plots
There is no need to scour the internet for data. This resource includes the data and the format to challenge your students' skills with data displays.This packet includes worksheets that provide opportunities for students to create histograms, dot plots, and box plots.They can be used as guided practice or as "on your own" activities.INCLUDES3 worksheets with realistic data.3 worksheets with REAL data (Apple stock prices, US Olympic athlete ages, and the Oscars:Best Picture/ Movie Times)AND 3 wo
Subjects:
Grades:
6th - 9th
Types:
CCSS:
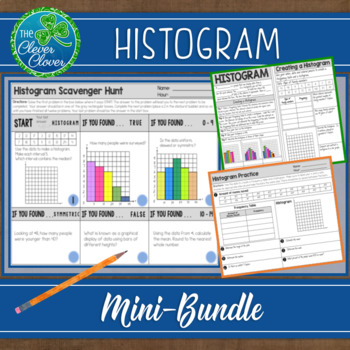
Histogram - Notes, Practice Worksheets and Scavenger Hunt
This histogram resource includes guided notes, a practice worksheet and a scavenger hunt. Your students will have the opportunity to create, interpret and discuss histograms. Below, you will find a detailed description of the notes, worksheet and scavenger hunt. Guided NotesThere are two small pages of guided notes. The first page provides the definition of a histogram and step by step instructions on how to create a histogram. The bottom portion of the notes has students examine three types (un
Subjects:
Grades:
6th - 9th, Adult Education
CCSS:
Also included in: Statistics Bundle - Guided Notes, Worksheets & Scavenger Hunts!

Algebra 1 Google Forms Semester 2 Digital and Printable Homework Bundle
This bundle includes all SEMESTER 2 Algebra 1 editable Google Forms homework assignments, quizzes, and tests that I have created. Every assignment also includes a "worksheet" that corresponds with the questions on each form. Just assign digitally or print + go!Not 1:1? Not using Google Classroom, yet? All of these assignments also come with a stand-alone "worksheet" that may be used with or instead of the digital resource. The SEMESTER 2 BUNDLE includes concepts within the following units:
Subjects:
Grades:
8th - 11th
Types:
CCSS:
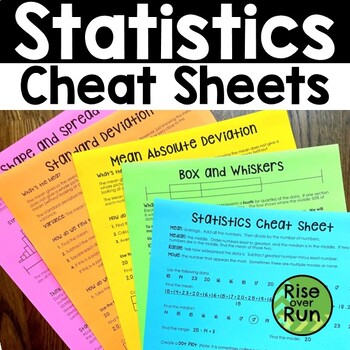
Statistics Cheat Sheets Notes with MAD, Standard Deviation, Shape & Spread
Grab these guided notes and "cheat sheets" to help your students understand statistics standards from Algebra I. Included Topics: Statistics Basics (mean, median, mode, range, dot plots, histograms, stem and leaf plots) Box and Whiskers Mean Absolute Deviation Standard Deviation Shape and Spread (Skewed Left and Skewed Right) The set includes each topic in the format of a cheat sheet and guided notes. The cheat sheets already have all the information filled in. They can be printed and given
Subjects:
Grades:
9th - 10th
Types:
CCSS:
Also included in: Algebra 1 and 8th Grade Math Curriculum Bundle for Entire Year
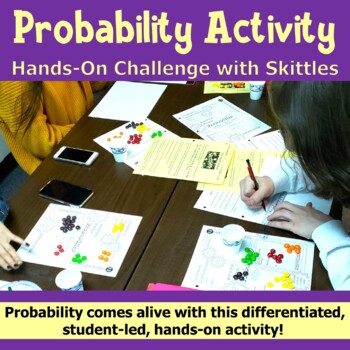
Probability Activity - Hands-On Challenge with Skittles - PBL with Math
Probability comes alive with this differentiated, student-led activity! The Skittles Probability Challenge provides practice using simple and compound probabilities in both theoretical and experimental fashion. Each student is given random data to work with. No two samples are identical. Students will: Make predictions based on logic.Determine the sample size of their personal data.Create a simple or two-way table to organize their data.Construct a graph or box & whisker plot to display the
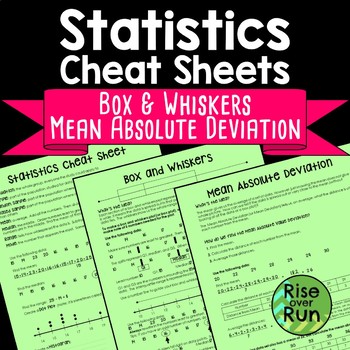
Box and Whiskers and Mean Absolute Deviation Cheat Sheets
Help students understand statistics vocabulary, dot plots, histograms, and box and whiskers diagrams, and mean absolute deviation with this resource.The three-page handout comes in two formats:Reference “Cheat Sheet” with all information filled in (pages 2-4)Guided Notes format with fill-in blanks and practice problems (pages 5-7)The first sheet defines important terms and helps students understand dot plots (or line plots) and histograms. The second sheet guides students in creating a box and w
Subjects:
Grades:
6th - 9th
Types:
CCSS:
Also included in: 7th Grade Math Activities, Lessons, Projects & More Bundle
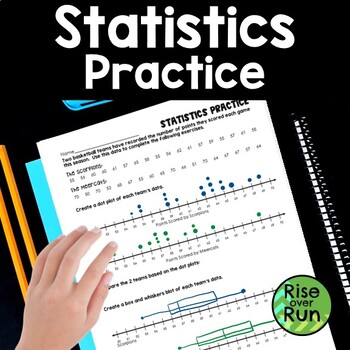
Box and Whiskers and Dot Plot Practice
Practice creating dot plots and box & whiskers plots with this statistics activity.Students are given scores for 2 basketball teams. They use the data to create a dot plot (or line plot) for each team and then a box and whiskers diagram for each team.Then, they compare the data of the teams.A bonus question asks students to calculate the mean absolute deviation.This worksheet can lead to great discussions about how to analyze box and whisker diagrams and make comparisons!
Subjects:
Grades:
6th - 7th
Types:
CCSS:
Also included in: Algebra 1 and 8th Grade Math Curriculum Bundle for Entire Year
NC Math 1 Practice End-of-Course Test (North Carolina EOC Final Exam Review)
This full length 60-item multiple choice practice test is aligned to the North Carolina Standards for Math 1. It includes 16 non-calculator active questions and 44 calculator active questions. An answer key and item/standard alignment is included for easy data analysis.
Subjects:
Grades:
7th - 10th
Types:
CCSS:
![Preview of Statistics Final Exam and Review [AP, College, and Honors]](https://ecdn.teacherspayteachers.com/thumbitem/Statisticis-FinalReviewStudy-Guide-Exam-1711356723/original-699492-1.jpg)
Statistics Final Exam and Review [AP, College, and Honors]
You can use this Statistics Final Exam in an AP Statistics, Honors Statistics, or a College Statistics course as an assessment, review or both. What's Included?Included are 6 different versions, each including 60 well chosen representative questions in both multiple choice format and also in free response format*. These reviews and tests work well in class or as a take- home. The tests are editable with Adobe Acrobat Pro. Each test should take about 2 - 3 hours and can be taken with a graphin
Subjects:
Grades:
10th - 12th, Higher Education
Types:
CCSS:
Data Analysis and Statistics in Algebra 1 Google Forms Homework and Assessment
This Algebra 1 Google Forms bundle currently includes auto-grading assignments on the following skills related to data analysis and statistics:Measures of Central TendencyDot Plots and HistogramsBox PlotsStandard Deviation and The Empirical RuleTwo-Way Frequency TablesScatter PlotsEach assignment also includes a PDF "worksheet" for students to complete along with the form.All of the assignments in this bundle are also included in my:★ Algebra 1 (Semester 2) Google Forms BundleYou may also be int
Subjects:
Grades:
6th - 9th
CCSS:
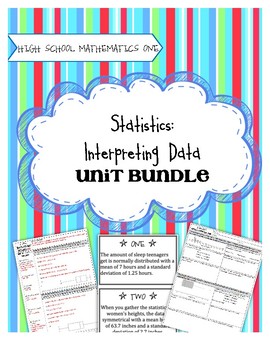
High School Math 1: Statistics and Interpreting Data
Task-Based Learning gets students intrinsically motivated to learn math! No longer do you need to do a song and dance to get kids interested and excited about learning. The tasks included in this unit, followed by solidifying notes and practice activities, will guarantee that students understand the concepts. This unit covers:
- Displaying one-variable data in a histogram, dot plot, or box plot
- Describing the distribution of data using statistical vocabulary
- Using data models and stati
Subjects:
Grades:
8th - 10th
Types:
CCSS:
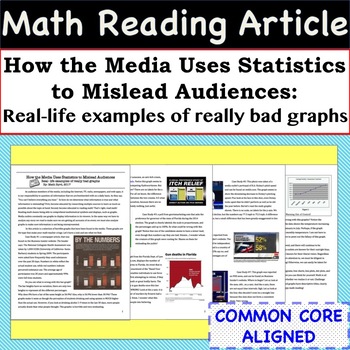
Statistics Math Article - Case Studies of Bad Graphs found in the Media
Incorporate Reading & Writing into the Math Classroom with this article and accompanying worksheet! The 4 page article is entitled - "How the Media Uses Statistics to Mislead Audiences: Real- life examples of really bad graphs". The worksheet helps students summarize the case studies and the article as a whole. This resource can be used in so many ways, some ideas are: station activity, independent reading assignment, small group activity, homework assignment, or whole class discussion.Skill
Subjects:
Grades:
8th - 11th
CCSS:
Also included in: Common Core Algebra 1 MATH READING ARTICLES - BUNDLE PRICE!
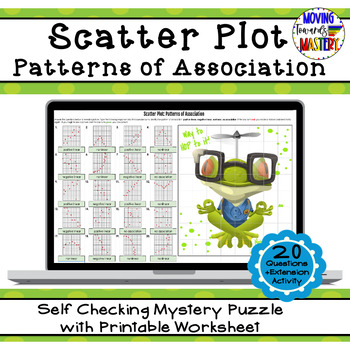
Scatter Plot: Patterns of Association Self Checking Mystery Picture
Engaging math self checking review activity to practice identifying patterns of association for scatter plots.This self-checking activity will allow students to practice identifying patterns of association for scatter plots. Students will use their understanding of scatter plots to answer questions to reveal pieces of a mystery puzzle as they work, just like a pixel art activity! If students answer incorrectly, the box will turn red and NO picture pieces will be revealed. This resource include
Subjects:
Grades:
7th - 10th
Types:
CCSS:
Also included in: 8th Grade Math Common Core Growing Bundle
Box and Whisker Plots Worksheet
Hello Math Teachers! Are you looking for a fun and engaging way to teach your students about Box and Whisker Plots? Our baseball-themed worksheet is perfect for middle school and algebra classes, as well as any statistics unit.This comprehensive worksheet includes both single and double box plots, and is designed to help students progress from interpreting box plots with quartiles, interquartile range, range, and median to constructing their own box plots. The two-sided worksheet comes with an e
Subjects:
Grades:
7th - 8th
Types:
CCSS:
Also included in: Data and Statistics Worksheets Bundle
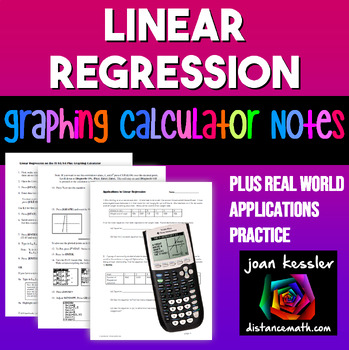
Linear Regression | TI-84 Graphing Calculator plus Applications
This clear, concise, step by step notes help your students use the TI 83 and TI 84 Graphing Calculator to enter data into lists, create a linear regression equation and to plot the equation along with the data simultaneously. Also included is a 3 page worksheet with five real world examples for students to practice. Solutions included. These can be used as Binder Notes or printed smaller for Interactive Notebooks._________________________________________________Related Products★ Quadratic Re
Subjects:
Grades:
9th - 11th, Higher Education
Types:
CCSS:
Also included in: Linear Functions and Systems Algebra 2 Unit 2 Activity Bundle
Histograms Interpreting and Creating Worksheet
Hey Math Teachers! This Histograms Worksheet is the perfect resource to help your students master constructing and interpreting histograms. This two-sided Math worksheet includes progressively challenging problems on displaying numerical data using histograms and questions on interpreting histograms. We provide scaffolding to help your students identify the components of a set of data, assess the skew of data, and report the number of observations.This worksheet is suitable for Middle School Mat
Subjects:
Grades:
6th - 9th
Types:
CCSS:
Also included in: Data and Statistics Worksheets Bundle
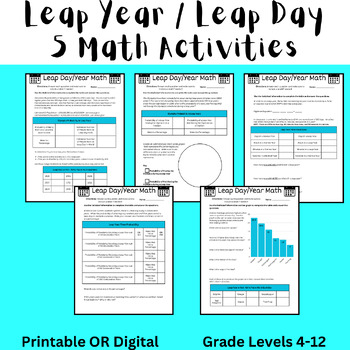
Leap Day (Leap Year) 2024 Math Activity (Algebra and Data) Digital or Printable
These 5 activities are fun NO PREP math activities to do to celebrate Leap Day 2024 (Leap Year 2024). The activities can be completed as 5 separate pages or as a 5 page packet. There is a customizable digital resource (Google Document) and a printable resource (Canva) that contain the same directions and activity. This was designed for students in middle school, but could be used for upper elementary and high school students in Pre Algebra, Pre-Algebra, or Algebra. In this assignment, students
Subjects:
Grades:
4th - 12th, Higher Education, Adult Education
Types:
Also included in: Leap Year (Leap Day) 2024 Bundle - Math, Reading, Writing, and Trivia

Algebra 1 Digital Activity Bundle plus Printables
This updated Bundle of 20 Interactive Algebra 1 Activities with Google® Slides is Paperless and No Prep for you. They are engaging and fun learning for your students. This is a great supplement to your Algebra 1 Curriculum. Many come with Printable versions.I have bundled 20 of my most popular fun, engaging, interactive Algebra 1 activities together for you to get you started with 1:1 Paperless activities in your Algebra classroom. There are over 200 slides with activities including Mazes, D
Sports Statistics & Probability curriculum workbook (130+ pages) - Project-based
WATCH THE PREVIEW CLIP! E-MAIL ME FOR DISCOUNTS OR QUESTIONS AT MEDEIROSVINNY@YAHOO.COM.Looking to start an elective math class? Interested in project-based assessments?Tired of teaching statistics with no real-world application?This 132-page interactive workbook serves as a textbook for an introductory statistics math class; complete with Common Core standards crosswalk, embedded answers, and tons of activities and mini-projects. This workbook is the only resource I use for my 'Statistical R
Subjects:
Grades:
8th - 12th
Types:
CCSS:
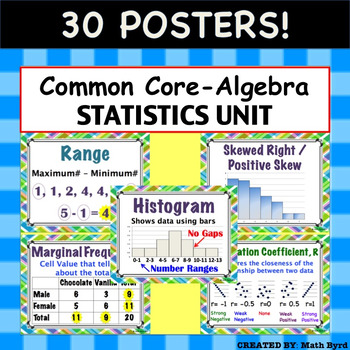
Common Core Algebra - Statistics Unit: Describing Data POSTERS
30 Posters! Each 8.5" x 11" in size. Posters are aligned with Common Core's Algebra - Statistics: Describing Data Unit. Posters Included:MeanMedianModeRangeInterquartile RangeOutlierMean Absolute DeviationMeasures of CenterMeasures of SpreadDot PlotHistogramBox PlotNormal/ Bell Shaped DistributionSkewed Right/Positive SkewSkewed Left/ Negative SkewUniform2 Way Frequency TableJoint FrequencyMarginal Frequency2 Way Relative Frequency TableConditional Relative FrequencyScatter PlotCorrelationCorrel
Subjects:
Grades:
8th - 11th
CCSS:
Also included in: Common Core Algebra 1 POSTERS - BUNDLE PRICE!
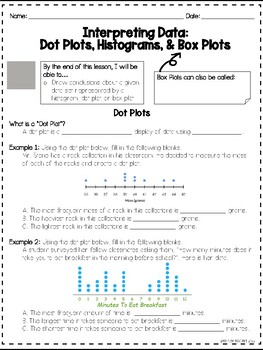
Statistics: Interpreting Data- Dot Plots, Histograms, & Box Plots Notes & HW
Students will be learning how to read and interpret different representations of statistical data through analyzing dot plots, histogram, and box plots. There is a practice at the end for them to work on independently.
Subjects:
Grades:
6th - 10th
CCSS:
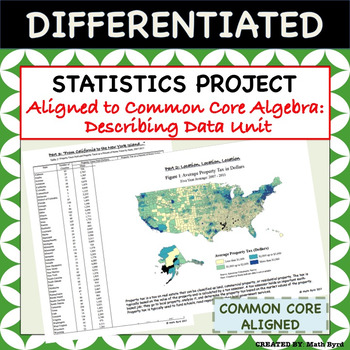
Statistics Project - Aligned to Common Core Algebra - Describing Data Unit
This differentiated U.S. Home Energy & Tax Themed Statistics Project covers all of the "describing data" standards of the Common Core Algebra Course using real data! Students will analyze various forms of tables & graphics to make inferences and interpret the data. The project is perfect for use as a summative assessment since students are required to justify their findings in open-ended format. Allow students to work in pairs, small groups, or individually! A grading rubric and selected
Subjects:
Grades:
8th - 11th
Types:
CCSS:
Also included in: Common Core Algebra 1 PROJECTS - BUNDLE PRICE!
Common Core Math 1: Statistics Unit-5 Days of Lesson Plans!!
This unit bundle is 25% less than buying these products individually! It contains 3 teaching lessons, a test review, and test. Answer keys included for everything.
Day 1: Guided notes and worksheet on Mean, Median, and Mode and Box and Whisker Plots.
Day 2: Guided notes, activity, and worksheet on standard deviation and the effects of outliers on the mean, standard deviation, range, and interquartile range.
Day 3: Guided notes, activity, and worksheet on dot plots, histograms, tables, an
Subjects:
Grades:
8th - 11th
Types:
CCSS:

Statistics Survey Project - Project Based Learning (PBL) with Math
Watch your students dive into the world of math as they create, execute, and analyze their own survey! Students will demonstrate mastery of data gathering, survey sampling, developing appropriate survey questions, data tables, Direct Variation, discrete graphs, dot plots, box and whisker graphs, and calculating the inter-quartile range.The Unique Survey Project is highly engaging, capitalizing on the innate curiosity of the adolescent mind. You will love the low-prep instructional guide. Your st
Subjects:
Grades:
6th - 10th
Types:
Also included in: Fun with Ratios Activities Bundle - 7th Grade PBL with Math
Showing 1-24 of 343 results

