
Box and Whiskers and Dot Plot Practice


Rise over Run
23.9k Followers
Grade Levels
6th - 7th
Subjects
Resource Type
Standards
CCSS6.SP.B.4
CCSS7.SP.B.3
CCSS7.SP.B.4
CCSSHSS-ID.A.1
CCSSHSS-ID.A.2
Formats Included
- PDF
Pages
1 Student Page + Answer Key
Rise over Run
23.9k Followers
What educators are saying
I used this one-page handout as a homework assignment. Two types of plots on one page was exactly what I needed mid-unit. Thanks for putting on TpT!
This worksheet hit all the important pieces for dot plots and box plots. It was exactly what I was looking for and my students were thoroughly engaged throughout their time working on this worksheet.
Also included in
 Do you love discovery learning, collaboration, hands-on activities, and projects that help students make sense of the math they are learning? This curriculum is packed with engaging and challenging Algebra I and 8th grade math resources for the whole year. A variety of activities, inquiry learningPrice $350.00Original Price $677.94Save $327.94
 This curriculum bundle includes a variety of activities, assessments, games, group activities, projects, inquiry lessons, guided notes, and more for teaching Algebra I CCSS standards. The activities are centered on discovery learning and engaging activities with real world connections. Lessons helpPrice $225.00Original Price $445.21Save $220.21
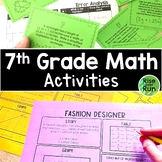 Looking for seventh grade math resources that are engaging, meaningful, standards-based, and help build conceptual understanding? In this big pack are over 50 resources that include hands-on learning, card sorts, games, projects, collaborative group activities, and more! These activities are rigorouPrice $95.00Original Price $145.22Save $50.22
 Easily prepare for a substitute! The sub binder pages plus the 7 math activities included in this bundle can be used throughout the year in 7th grade math. Some resources review important concepts from previous grades, and some are seventh grade standards. What's included:Perimeter & Area ofPrice $9.00Original Price $13.50Save $4.50
 No more boring box plot lessons! These activities are engaging and will help your students see how box plots are really useful with real world data. Grab these 5 resources, print, and be ready to go! Here are the resources included in this bundle:Box & Whiskers Real World Temperature LessonIn tPrice $9.00Original Price $15.50Save $6.50
Description
Practice creating dot plots and box & whiskers plots with this statistics activity.
Students are given scores for 2 basketball teams. They use the data to create a dot plot (or line plot) for each team and then a box and whiskers diagram for each team.
Then, they compare the data of the teams.
A bonus question asks students to calculate the mean absolute deviation.
This worksheet can lead to great discussions about how to analyze box and whisker diagrams and make comparisons!
Total Pages
1 Student Page + Answer Key
Answer Key
Included
Teaching Duration
1 hour
Report this resource to TPT
Reported resources will be reviewed by our team. Report this resource to let us know if this resource violates TPT’s content guidelines.
Standards
to see state-specific standards (only available in the US).
CCSS6.SP.B.4
Display numerical data in plots on a number line, including dot plots, histograms, and box plots.
CCSS7.SP.B.3
Informally assess the degree of visual overlap of two numerical data distributions with similar variabilities, measuring the difference between the centers by expressing it as a multiple of a measure of variability. For example, the mean height of players on the basketball team is 10 cm greater than the mean height of players on the soccer team, about twice the variability (mean absolute deviation) on either team; on a dot plot, the separation between the two distributions of heights is noticeable.
CCSS7.SP.B.4
Use measures of center and measures of variability for numerical data from random samples to draw informal comparative inferences about two populations. For example, decide whether the words in a chapter of a seventh-grade science book are generally longer than the words in a chapter of a fourth-grade science book.
CCSSHSS-ID.A.1
Represent data with plots on the real number line (dot plots, histograms, and box plots).
CCSSHSS-ID.A.2
Use statistics appropriate to the shape of the data distribution to compare center (median, mean) and spread (interquartile range, standard deviation) of two or more different data sets.
Reviews
Questions & Answers
23.9k Followers
