45 results
Common Core HSS-ID.A.1 resources for Microsoft PowerPoint
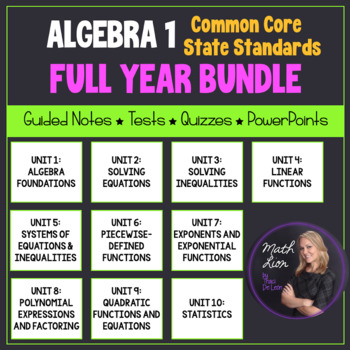
Algebra 1 Curriculum - Full Year EDITABLE Unit Plans | Bundled for Common Core
This is a great bundle that covers concepts for a full year Algebra 1 course! 76 lessons are included! Documents are EDITABLE!Included:- Overview of the common core alignment tandards (Two 18-week guides) (PDF and Word) - Overview of the common core alignment (PDF)- Guided notes for 76 lessons (PDF and Word)- PowerPoint presentations (aligned with guided notes) (PPTX)-10 Mid-unit quizzes (PDF and Word)-10 Unit tests (PDF and Word)-2 Semester exams (PDF and Word)Each lesson contains a learning
Grades:
8th - 12th
CCSS:
Statistics Project - Statistics Olympics
Engage your students in their study of statistics as they compete in self-created Olympic style events. This project will engage students and help them discover meaning and apply concepts including measures of central tendency, quartiles, outliers, variance, standard deviation, z-scores, box plots, histograms, normal and skewed distributions. This project can be completed in approximately 6-8 days (50-min class periods) ** March 2023 Update **Visual updates to all slides and documentsRubric ali
Subjects:
Grades:
6th - 12th
CCSS:
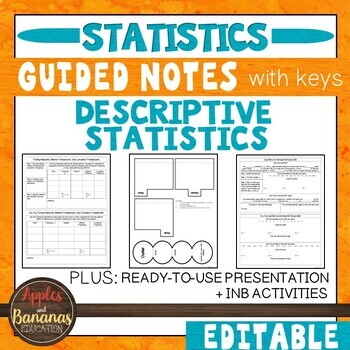
Descriptive Statistics- Guided Notes, Presentation, and INB Activities
This Introduction to Statistics product is flexible, editable, and can be used for in-person or distance learning. Take the time and stress out of creating your own guided notes and presentations. There are many ways to use this engaging bundle. It includes guided notes embedded with student practice problems (keys included), foldable activities, and a PowerPoint presentation for focused instruction. Choose what works best for your class/student and modify to make the content fit your needs. Not
Subjects:
Grades:
9th - 12th
CCSS:
Also included in: Custom Bundle for Viet
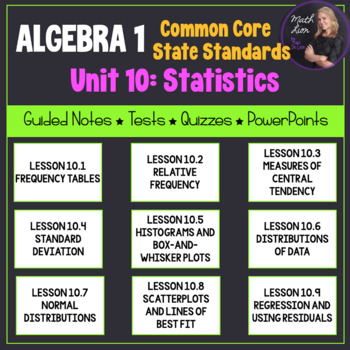
Statistics (Algebra 1 Curriculum - Unit 10) | Bundle for Common Core
This is a great unit that covers a Statistics unit in an Algebra 1 course! 9 lessons are included!All documents are EDITABLE!Included:- Overview of the common core alignment (PDF)- Guided notes for 9 lessons (PDF and Word)- PowerPoints that coordinate with the guided notes (PPTX)- Mid-Unit Quiz (PDF and Word)- Unit Test (PDF and Word)-Pacing Guide (PDF and Word)Each lesson contains a learning scale, warm up (do-now or bell ringer), key concepts, vocabulary, and examples for students to follow w
Subjects:
Grades:
7th - 12th
CCSS:
Data Project Misleading Data Analysis Statistics
Statistics can be used to share information. Sometimes the data is misleading. In this AP Statistics mini project students examine how data can be used to tell a story AND how that story can be incomplete. This is part of the AP Statistics curriculum.Included in this resource:Warm-up activity for misleading dataMisleading data project guidelinesEditable RubricAnswer key for activityThis resource can be found in the following bundles:AP Statistics CurriculumAP Statistics Unit 1Get students r
Subjects:
Grades:
9th - 12th
Types:
CCSS:
Also included in: Descriptive Statistics AP Statistics
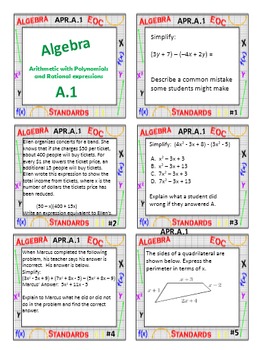
Algebra 1 Review Task Cards
This product covers the domains of Algebra, Functions, Numbers and Quantity, and Probability and Statistics, and includes:
- Task Cards by standard (306 total questions)
- Answer Keys by standard
- Student answer sheets
Each standard adopted by Louisiana for Algebra 1 is covered, however cards can easily be used in other states and by non-CCSS states.
These task cards are a great way to review throughout the year as well as at the end of the year before end of course tests. This allows stu
Subjects:
Grades:
7th - 10th
CCSS:
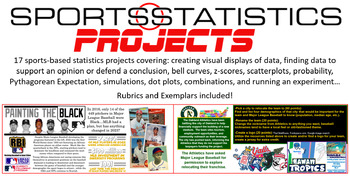
Sports Statistics - Projects ONLY! 17 projects in all
Most of the projects allow students to choose their own topic to display their understanding of statistical topics. Students will:Create a graph of their choosing given dataDesign an infographic on the subject of their choosingResearch and defend their G.O.A.T. choice in a variety of categoriesUse demographics to relocate and rebrand a professional franchiseResearch social injustices in sports and display the dataCreate a bell curve based on career statistics of Michael JordanCompare the salari
Subjects:
Grades:
8th - 12th
CCSS:
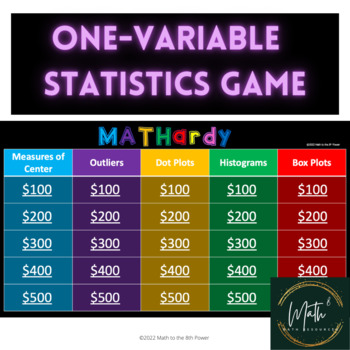
Single Variable Statistics Review Game | One-Variable Stats Game
This "Jeopardy-style" game includes the following categories:Measures of CenterOutliersDot PlotsHistogramsBox PlotsThis activity is a great way to engage students in a review of Single Variable Statistics before an assessment or as a review, and can be used in the classroom or virtually! GREAT FOR AN ENGAGING TEST PREP!You can edit/modify any questions or categories for your own classroom use, but not for commercial use. This .ppt file is fully linked so that the home screen takes you to the q
Subjects:
Grades:
6th - 9th
Types:
CCSS:
Statistics Survey project Discovery (broken down into sections) with Rubric
This is a broken down (scaffolded) packet of instructions/ guide for a Stats Project for Math 1 HS or 8th grade students. The goal of the project is for students to take a statistical survey on quantitative data (numbers) of their choice. Using this data from the survey, the following will be included in the project:Survey- the question being askedSurvey responses (requirement of 30)Data organization: Bar chart, Histogram, Dot PlotMeanMedianModeBox and Whisket Plot5 number summary (Q1,Q2,Q3, min
Subjects:
Grades:
7th - 12th, Higher Education, Adult Education
CCSS:
Statistics Unit 2 Bundle - Frequency Distributions Curriculum (6 days)
This is a unit plan bundle for a Statistics class. The plans include common core math standards, time frame, activities, enduring understandings, essential questions, and resources used. It is designed to last 6 days. The plans include: 21-slide presentation, with annotated guide for reference2 Worksheets"Do Now" Entrance problemsSpreadsheet Activity - "Spreadsheets and Heartbeats"Unit ReviewUnit TestGraphing Calculator instructions included on slidesPacing guide with administrative unit planAll
Subjects:
Grades:
9th - 12th, Higher Education
CCSS:
Data and Statistics for Algebra Unit
Make lesson planning easy with this no-prep Data and Statistics for Algebra Unit! Included are 11 ready-made lessons. This unit is very easy to use and will save you a lot of time!Use the Data and Statistics for Algebra Unit to cover Algebra 1/Math 1 data and statistic topics. You will enjoy the ease of using our editable PowerPoints with guided notes. Students will love the Algebra lessons when you use the included activities for each lesson! Great Algebra Lessons to use for Home School!The Dat
Grades:
8th - 9th
CCSS:
Algebra 1 Review Task Cards - Probability and Statistics
This product covers the domain of Probability and Statistics for Algebra 1 and includes:
- Task Cards by standard (50 total questions)
- Answer Keys by standard
- Student answer sheets
Each standard adopted by Louisiana for Algebra 1 in the Probability and Statistics domain is covered, however cards can easily be used in other states and by non-CCSS states. For a a FREE checklist and description of the standards, please check our store.
These task cards are a great way to review throughout th
Subjects:
Grades:
7th - 10th
Types:
CCSS:
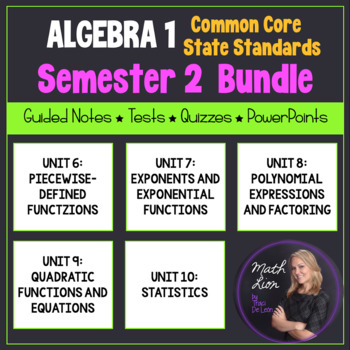
Algebra 1 Curriculum - Semester 2 EDITABLE Unit Plans | Bundled for Common Core
This is a great bundle that covers concepts for the second semester of an Algebra 1 course!Included:- Pacing guides with common core state standards (18-week guide) (PDF and Word)- Overview of the common core alignment (PDF)- Guided notes for 39 lessons (PDF and Word)- PowerPoint presentations (aligned with guided notes) (PPTX)-5 Mid-unit quizzes (PDF and Word)-5 Unit tests (PDF and Word)-Semester exam (PDF and Word)Each lesson contains a learning scale, warm up (do-now or bell ringer), key conc
Subjects:
Grades:
8th - 12th
CCSS:
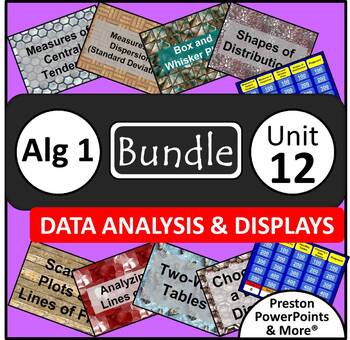
(Alg 1) Data Analysis and Displays {Bundle} in a PowerPoint Presentation
Algebra 1 Data Analysis and Displays {Bundle} in a PowerPoint PresentationThis is a bundle include the eight PowerPoint lessons below and two Quiz Show games, Jeopardy Style, for review.Measures of Central Tendency S.ID.2, S.ID.3Measures of Dispersion (Standard Deviation) S.ID.2, S.ID.3Box-and-Whisker Plots S.ID.1, S.ID.2, S.ID.3Shapes of Distributions S.ID.2, S.ID.3Quiz Show Game Central Tendencies and Dispersion S.ID.1, S.ID.2, S.ID.3Scatter Plots and Lines of Fit 8.SP.1, S.ID.6a, S.ID.6c, S
Grades:
8th - 10th
CCSS:
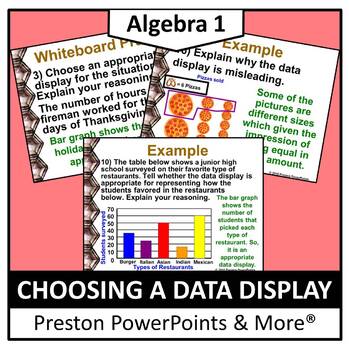
(Alg 1) Choosing a Data Display in a PowerPoint Presentation
Algebra 1 Choosing a Data Display in a PowerPoint PresentationThis slideshow lesson is very animated with a flow-through technique. I developed the lesson for my Algebra 1 class, but it can also be used for upper level class reviews. This lesson teaches how to choose appropriate data displays and identify and analyze misleading data displays.This lesson has SKELETON NOTES, notes that have the problem only. I used this with our 1-1 district devices. This will allow for the students to follow th
Grades:
8th - 10th
CCSS:
9th Grade Saxon Secondary 1 Math Powerpoints
These 120 Powerpoint lessons work hand in hand with the Saxon Algebra 1 math textbook. If you do not teach the Saxon program then these Powerpoints can be used to help teach the Secondary 1 Common Core. Each Powerpoint consists of a lesson overview which includes formulas and direct instructions. After that there are several practice problems that allows students to put into practice what they just learned. This is a great opportunity for group work as well as for the teacher to walk around the
Grades:
8th - 9th
Types:
CCSS:
AP Statistics: Unit 1, Ch 2: Modeling Distributions of Data, Stats Medic Aligned
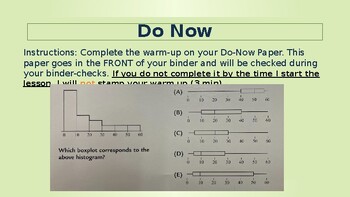
Hi! If you're following my series of PowerPoints for the Stats Medic curriculum, this resource is for you. The PowerPoint includes the ENTIRE sequence of activities, notes, and lessons aligned to Unit 1, Chapter 2: Modeling Distributions of Data in the Stats Medic curriculum for AP Statistics. The resource is a Microsoft PowerPoint, so feel free to edit the cadence of activities as you need. Each block is separated by a warm-up slide so you'll know when the PowerPoint ends for each class period
Subjects:
Grades:
11th - 12th, Higher Education
CCSS:
(Alg 1) Box and Whisker Plots in a PowerPoint Presentation
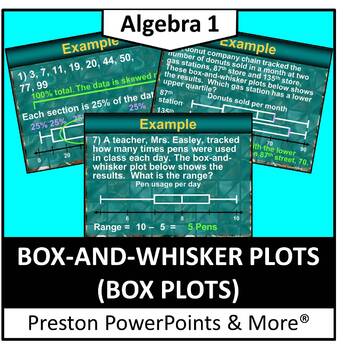
Algebra 1 Box and Whisker Plots in a PowerPoint PresentationThis slideshow lesson is very animated with a flow-through technique. I developed the lesson for my Algebra 1 class, but it can also be used for upper level class reviews. This lesson teaches how to make and interpret box-and-whisker plot to organize real-life data, find interquartile ranges of data sets, and compare box-and-whisker plots.This lesson has SKELETON NOTES, notes that have the problem only. I used this with our 1-1 distri
Subjects:
Grades:
6th - 10th
CCSS:
Statistics Unit 3 Bundle - Central Tendency and Variation Curriculum (9 days)
Statistics Unit 3 Bundle - Central Tendency and Variation Curriculum (9 days)This is a unit plan bundle for a Statistics class. The plans include common core math standards, time frame, activities, enduring understandings, essential questions, and resources used. It is designed to last 2 weeks. The bundle includes:28-slide presentation, with annotated guide for reference2 Worksheets"Do Now" Entrance problems1 Quiz2 Spreadsheet activities (Mean Median Mode Spreadsheet Project from my store includ
Subjects:
Grades:
9th - 12th, Higher Education
CCSS:
Box and Whisker Plot Analysis and Construction including Outliers
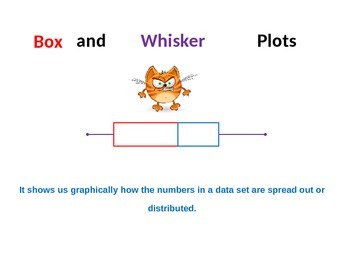
I use this MS PowerPoint presentation file to kickoff our study of Box Plots in my Pre-Algebra and Math I classes. It reviews in detail how to analyze a data set and to construct a Box Plot to accurately depict the distribution of the data (numbers). It is a totally animated ppt file and very easy for students to understand. Any of the ppt animations can be modified as desired by the presenter (teacher). It also includes 2 example problems for the students to complete at the end of the slid
Subjects:
Grades:
7th - 9th
CCSS:
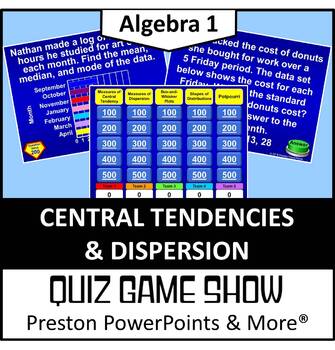
(Alg 1) Quiz Show Game Central Tendencies and Dispersion in a PowerPoint
Algebra 1 Quiz Show Game Central Tendencies and Dispersion in a PowerPoint PresentationThis Quiz Show game, Jeopardy Style, is a great way to review a chapter. There are 25 questions and a scoreboard so you don’t have to write it on a side board. Each page has the point value!This Quiz Show game covers all of the following:Measures of Central Tendency S.ID.2, S.ID.3Measures of Dispersion (Standard Deviation) S.ID.2, S.ID.3Box-and-Whisker Plots S.ID.1, S.ID.2, S.ID.3Shapes of Distributions S.ID
Subjects:
Grades:
6th - 10th
CCSS:
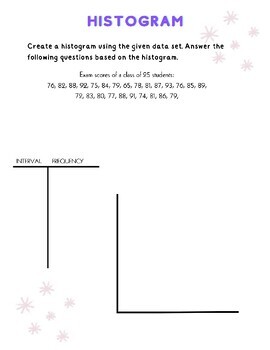
Histogram, Dot Plot, and Stem and Leaf Review Worksheet - with Answer Key
Introducing the "Exploring Data Distributions" Review Worksheet Pack - a comprehensive and engaging resource designed for middle school and high school students to master the concepts of histograms, dot plots, and stem-and-leaf plots. Answer key included and absolutely no prep required.This review worksheet is carefully crafted to provide students with a solid understanding of data distributions. It covers key topics such as creating and interpreting histograms, dot plots, and stem-and-leaf plo
Subjects:
Grades:
6th - 12th
CCSS:

Qualitative and Quantitative Data Graphing Project Collecting Data Rubric
Descriptive Statistics Project Qualitative and Quantitative Data Graphical ReperesentationsTo get students more engaged with their math assessment, have them collect data for a project. Some sample question are provided for both qualitative and quantitative data sets. Or, student have the option of creating their own question.Students are asked to collect data from 50 students for both qualitative and quantitative data survey questions. This file is editable, so if 50 students seems like too
Subjects:
Grades:
9th - 12th
Types:
CCSS:
Graphing in Science: A Google Slides Lesson PLUS Guided Notes Handout!
This EDITABLE Google slides (powerpoint) presentation AND guided notes handout covers all of the essential information students need to create and analyze graphs in science. This lesson is designed to refresh students on the concepts of creating graphs using scientific data, analyzing relationships between independent and dependent variables, and includes lots of examples and practice opportunities! This lesson can be used to introduce the important concepts of graphing in science, or it can be
Subjects:
Grades:
5th - 12th, Higher Education, Adult Education
CCSS:
Also included in: Introduction to Science: Unit Bundle! No Prep Required!
Showing 1-24 of 45 results

