20 results
Common Core HSS-ID.A.1 resources for Easel
![Preview of Statistics Final Exam and Review [AP, College, and Honors]](https://ecdn.teacherspayteachers.com/thumbitem/Statisticis-FinalReviewStudy-Guide-Exam-1711356723/original-699492-1.jpg)
Statistics Final Exam and Review [AP, College, and Honors]
You can use this Statistics Final Exam in an AP Statistics, Honors Statistics, or a College Statistics course as an assessment, review or both. What's Included?Included are 6 different versions, each including 60 well chosen representative questions in both multiple choice format and also in free response format*. These reviews and tests work well in class or as a take- home. The tests are editable with Adobe Acrobat Pro. Each test should take about 2 - 3 hours and can be taken with a graphin
Subjects:
Grades:
10th - 12th, Higher Education
Types:
CCSS:

Climate Change Graphing Activity
Students graph the changes in average global temperature over time, and then analyze, predict, and explain the significance of climate change on the Earth and its people.Students read info related to climate change, then create a graph of average global temperature changes over the past 140 years. Students are then to answer several analysis questions, which could also be used to drive a meaningful classroom discussion about climate change.Included is a teacher's key which shows what the resulti
Subjects:
Grades:
5th - 11th
Types:
CCSS:
Box and Whisker Plots Worksheet
Hello Math Teachers! Are you looking for a fun and engaging way to teach your students about Box and Whisker Plots? Our baseball-themed worksheet is perfect for middle school and algebra classes, as well as any statistics unit.This comprehensive worksheet includes both single and double box plots, and is designed to help students progress from interpreting box plots with quartiles, interquartile range, range, and median to constructing their own box plots. The two-sided worksheet comes with an e
Subjects:
Grades:
7th - 8th
Types:
CCSS:
Also included in: Data and Statistics Worksheets Bundle
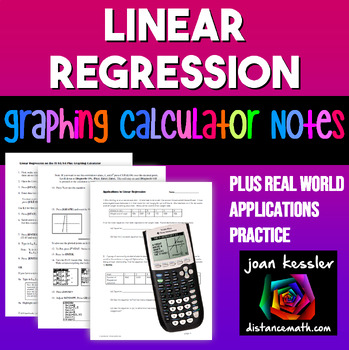
Linear Regression | TI-84 Graphing Calculator plus Applications
This clear, concise, step by step notes help your students use the TI 83 and TI 84 Graphing Calculator to enter data into lists, create a linear regression equation and to plot the equation along with the data simultaneously. Also included is a 3 page worksheet with five real world examples for students to practice. Solutions included. These can be used as Binder Notes or printed smaller for Interactive Notebooks._________________________________________________Related Products★ Quadratic Re
Subjects:
Grades:
9th - 11th, Higher Education
Types:
CCSS:
Also included in: Linear Functions and Systems Algebra 2 Unit 2 Activity Bundle
Histograms Interpreting and Creating Worksheet
Hey Math Teachers! This Histograms Worksheet is the perfect resource to help your students master constructing and interpreting histograms. This two-sided Math worksheet includes progressively challenging problems on displaying numerical data using histograms and questions on interpreting histograms. We provide scaffolding to help your students identify the components of a set of data, assess the skew of data, and report the number of observations.This worksheet is suitable for Middle School Mat
Subjects:
Grades:
6th - 9th
Types:
CCSS:
Also included in: Data and Statistics Worksheets Bundle
Algebra 2 Final Exam or Review Packet Part 2
This Algebra 2 - Part 2 Review can be used as a Final Exam, or Warm Ups and includes 300 Questions in 5 Versions. It can also be used as a Pretest or review for many topics in PreCalculus. Since Algebra 2 Curriculum differs between schools, I have created this to supplement Algebra 2 End of Course Reviews with 250 Questions Part 1 with topics found in many Algebra 2 curricula, especially those that are Common Core or similar.TOPICS INCLUDE • Conics: Circles, Ellipses, Hyperbolas, Parabolas
Subjects:
Grades:
9th - 12th
Types:
CCSS:
Also included in: Algebra 2 EOC Review or Exam Bundle
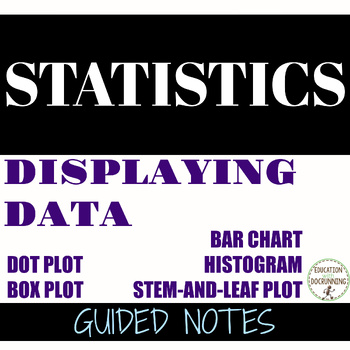
Displaying Data notes Histogram Box Plot Dot Plot Stem and leaf plot
Guided notes for descriptive statistics and displaying data includes bar graph, histograms, dot plots, box plots (aka box and whisker plot), and stem-and-leaf plots. This is Unit 1: lesson 3 in the AP Statistics Curriculum.Included in this resource:Interactive notebook pages graphic organizersGuided notes Practice ("try it") pages for individual or partner work NotesAnswer keyTopics included:Construct and analyze a bar graphConstruct and analyze a histogramBar graph vs histogramConstruct and an
Subjects:
Grades:
9th - 12th
CCSS:
Also included in: Descriptive Statistics AP Statistics
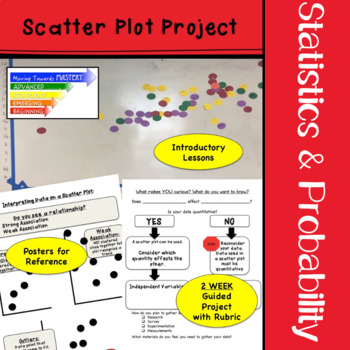
Scatter Plot Project End of Year Math Activity with Real World Data
TWO Week guided project for constructing and interpreting scatter plots. This engaging scatter plot project is individualized to allow students to research areas of interest. This project is great for a math end of year activity but it can also be used year round! Students will gather data on their topic of choice and use the project plan to organize their data into a scatter plot. Students will then analyze the results of the data collected.Six posters to guide students as they work independent
Subjects:
Grades:
8th - 10th, Higher Education
Types:
CCSS:
Also included in: Middle School Math Projects for End of the Year Activities
Stem and Leaf Plot Worksheet
Attention, Math Heroes! Are you ready to unleash your inner superhero and conquer stem and leaf plots like never before? Look no further! Our action-packed comic book movie themed worksheet is here to save the day and take your statistics lesson to new heights! Why Choose Our Stem and Leaf Math Worksheet? Engaging Comic Book Theme: Step into the world of superheroes with our dynamic comic book theme! From daring superheroes to epic villains, students will embark on an exciting math adventure as
Subjects:
Grades:
9th
Types:
CCSS:
Also included in: Data and Statistics Worksheets Bundle
Grade 11 Adjusted-Form Math SBA Summative as the Item Writers See the Test!!!
This guide is designed to help grade 11 teachers quickly determine the complex math skills required by students who take the grade 11, Adjusted-Form, SBA Mathematics Summative. Given this information, teachers can focus student learning and practice on the types of items/skills required by the grade 11 Summative. Included in the document are the Targets that item writers use when developing new items AND the standards which were used as content for the items that have been on the Pract
Subjects:
Grades:
11th
CCSS:
Box and Whisker Plots Foldable PDF+ EASEL
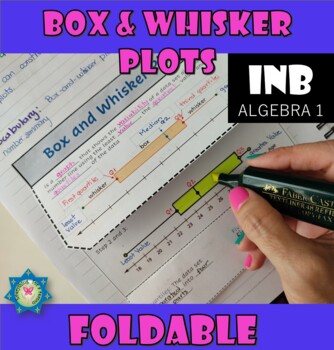
Are you looking for an activity to teach Box and Whisker Plots? This foldable/Graphic organizer will help you to teach students how to construct and interpret box-and-whisker plots. Perfect addition for your Math journals and suitable for grades 7th and 8th.Includes:- Definitions for Box-and-whisker plot, Quartiles, Five-number summary, and The Interquartile Range (IQR).- Easy steps and practical examples.This math resource can be used with Easel by TPT, Google Classroom for distance learning, h
Subjects:
Grades:
8th - 10th
CCSS:
Also included in: 8th Grade Math Interactive Notebook All-Year Curriculum PDF + EASEL
Circle Graphs Interpreting Data Worksheet
Attention Math Teachers! This Circle Graphs Worksheet is the ultimate resource to help your students become proficient in constructing and interpreting circle graphs. This comprehensive two-sided Math worksheet is suitable for Middle School Math through Algebra 1 classes and includes progressively challenging problems that will help your students master circle graphs.This Circle Graphs Worksheet is perfect for use as a homework assignment or a classwork activity, and we've included an easy-to-us
Subjects:
Grades:
7th
Types:
CCSS:
Also included in: Data and Statistics Worksheets Bundle

DATA DISPLAY EASEL Activity & Assessment-Basic Skills Snapshot-Diagnostic Lev. 2
Are your students HAVING DIFFICULTY USING DATA DISPLAYS? Are you trying to identify areas of weakness in applying these essential math skills? Quickly assess each student’s understanding of these critical concepts!! Address those deficiencies using EASEL -- duplicate & revise the EASEL template to build those skills!We have regrouped exercises from our popular math warm-ups to produce this Snapshot of Students’ Essential Skills in USING DATA DISPLAYS, utilizing the capabilities of TpT’s EA
Subjects:
Grades:
6th - 9th
Types:
Sampling Distributions Activity AP Statistics
Introduce students to sampling distributions with this inquiry activity. Students This is appropriate before formal notes to Sampling distributions in an AP Statistics Curriculum.Included in this resource:*3 part inquiry activityAnswer keyTeacher directionsTopics included:Sampling distributionsThis resource can be found in the following bundles:AP Statistics CurriculumAP Statistics Unit 3*NOTE: this activity requires 30 m&ms, beans or other colored markers per group (2-3 students)Get studen
Subjects:
Grades:
9th - 12th
Types:
CCSS:
Speed, Velocity and Acceleration Learning Activities
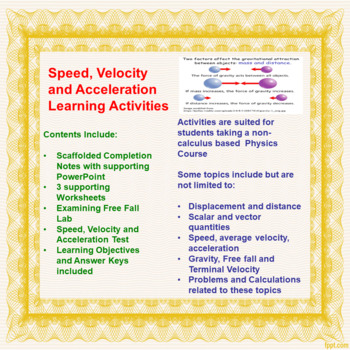
This zip file contains many different activities (54 pages of student handouts and 1 PowerPoint with a total of 47 slides) which can be used to compose a unit for physics students involving topics involving Speed, Velocity and Acceleration. Topics in this unit include distance, displacement, scalar and vector quantities, speed, velocity, average velocity, acceleration, free fall, calculations involving these topics as well as many other concepts.A free fall lab activity is contained within this
Subjects:
Grades:
9th - 12th, Higher Education
CCSS:
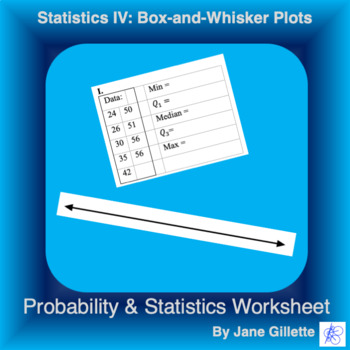
Statistics IV: Box-and-Whisker Plots
Given small data sets, find the five key points and make a box plot. This is ready to print, or to assign as an online Easel Activity. The digital version is ready-to-use, but you can edit the instructions and locations of answer boxes to fit your needs.
Subjects:
Grades:
6th - 12th
Types:
CCSS:

MEAN MEDIAN MODE RANGE EASEL Activity & Assessment - Skills Snapshot-Diagnostic
Are your students STRUGGLING with MEAN, MEDIAN, MODE & RANGE? Are you trying to identify areas of weakness with these essential math skills? Quickly assess each student’s understanding of these critical concepts!! Address those deficiencies using EASEL -- duplicate & revise the EASEL template to build those skills!We have regrouped exercises from our popular math warm-ups to produce this Snapshot of Students’ Essential Skills in MEAN, MEDIAN, MODE & RANGE using the capabilities of
Subjects:
Grades:
6th - 9th
Types:

DATA DISPLAY EASEL Activity & Assessment-Basic Skills Snapshot-Diagnostic Lev. 1
Are your students STRUGGLING with READING DATA DISPLAYS? Are you trying to identify areas of weakness with this essential math skill? Quickly assess each student’s understanding of this critical concept!! Address those deficiencies using EASEL -- duplicate & revise the EASEL template to build those skills!We have regrouped exercises from our popular math warm-ups to produce this Snapshot of Students’ Essential Skills in READING DATA DISPLAYS using the capabilities of TpT’s EASEL!! This pr
Subjects:
Grades:
6th - 9th
Types:
Mean, Median, Mode, and Visualizing Real Data - Group Activities
These activities and handouts task groups of students to calculate the mean, median, mode, and range of real data, as well as plotting a box plot and a histogram, through 6 group activities that can take 1 to 3 hours, depending on the class. Solutions are provided where applicable (3 activities).Target Level of Math Class:Pre-algebra, arithmetic, introduction to statistics, data visualizationAccess to calculators.For completion in groups in person, with students actively sharing solutions with
Subjects:
Grades:
Not Grade Specific
Types:
Pie Chart Notes Descriptive statistics AP Statistics
Guided notes for pie charts. This is Unit 1: lesson 3a in the AP Statistics Curriculum.Included in this resource:Interactive notebook pages Guided notesPractice ("try it") pages for individual or partner workNotesAnswer keyTopics included:Construct a pie chartInterpret a pie chartThis resource can be found in the following bundles:AP Statistics CurriculumAP Statistics Unit 1AP Statistics Unit 1 Notes OnlyGet students ready for the AP Statistics exam with the full curriculum. Questions? Leave y
Subjects:
Grades:
9th - 12th
CCSS:
Also included in: Descriptive Statistics AP Statistics
Showing 1-20 of 20 results

