11 results
Not grade specific statistics resources for Microsoft Excel
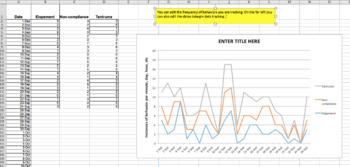
More Graphs Added! Graphing Basic Data For Students: An Excel Workbook
This is a great resource to use for data tracking for all of your students or clients. I have expanded the other Graphic Workbook on my TPT store. This resource is made to easily create graphs for a variety of skills or behaviors. As a result, this excel workbook can be used by teachers, behavior analysts, speech therapists, behavior intervention specialists, really anyone who needs data collection. The graphs can be shared during parent-teacher conferences, IEP meetings, included in student pro
Subjects:
Grades:
Not Grade Specific
Types:
5:28
Measures of Spread using Excel Statistics Mathematics (Standard Deviation)
This is a 5 min tutorial on how to use Excel to find IQR and Standard Deviation. I am a qualified Mathematics teacher for over 16 years with a computer science degree. I hope you find this helpful. If you do please follow and leave a review. It really helps my store. Thanks a bunch!
Grades:
Not Grade Specific
Types:
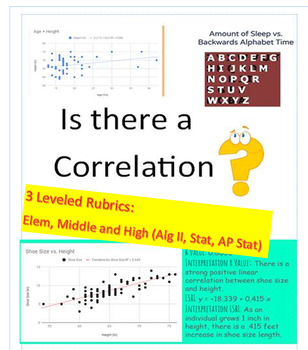
Correlation? Data Project (3 Rubrics_Elem/Middle School/ AP Stats) EOY
Get ready to supercharge your students' data analysis skills with this dynamic project! Perfect for end of year or semester project. In this engaging activity, students will have the exciting opportunity to collect their own data through surveys, online research, or real world data sets. They will then dive deep into the world of statistics as they determine if there is a correlation between two variables. With three different leveled rubrics, this project is perfect for students of all ages an
Subjects:
Grades:
Not Grade Specific
Types:
CCSS:
Also included in: High School Math Projects (Algebra II and Statistics) STEM No prep
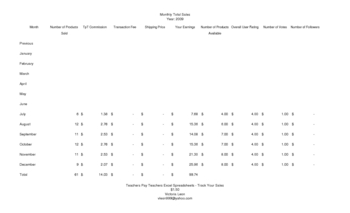
Teachers Pay Teachers Excel Spreadsheets - Track Your Sales
PC users may track their TpT sales using the following 18 Excel spreadsheets:
Track your Number of Products Sold, TpT Commission, Transaction Fee, Shipping Price,
Your Earnings, Number of Products Available, Overall User Rating, Number of
Votes, and Number of Followers using a Daily Total Sales, Weekly Total Sales,
Monthly Total Sales, Quarterly Total Sales, or Yearly Total Sales spreadsheet.
Track the sales of each of your products using a Daily Product Sales, Weekly
Product Sales, Monthl
Subjects:
Grades:
Not Grade Specific
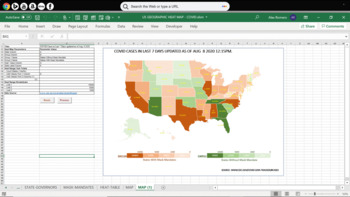
US Geographic Heat Map Generator
Using simple VBA code, this versatile Excel tool generates multi-variate geographic heat map using data files downloaded from publicly available sources.Watch the Youtube video to see how it works:https://www.youtube.com/watch?v=bJCgWko-2Bs
Subjects:
Grades:
Not Grade Specific

After School Attendance Workbook
This Excel workbook tracks student attendance in an after school program. Each student's days automatically tabulate on the End-of-Year Total Days page. Great spreadsheet to use when reporting to grant authorities or school administrators. Totals are computed by the month, day and year.Includes monthly interactive attendance sheets that can easily be managed by student/parent after school volunteers.
Grades:
Not Grade Specific
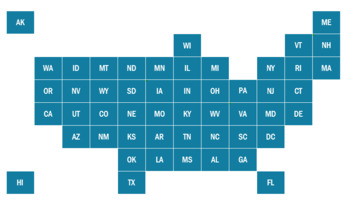
USA Tile Map Template for Microsoft Excel - Data Visualization
Editable Excel tile grid maps of the United States. Workbook includes four different map versions. Enter your own data and use the maps as they are, or customize fonts, text, and colors per your own style guidelines. Versions include 1) USA Heatmap with values as percents 2) USA Heatmap with values as counts 3) USA solid tile map with state labels 4) USA sold map with state labels and StateFace font icons (Note StateFace font can be downloaded free at www.fontsquirrel.com).Once you've entered yo
Subjects:
Grades:
Not Grade Specific
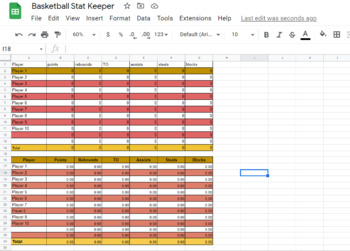
Basketball Stat Keeper Google Drive
Keep complete stats on this Google Sheets Document. Formulas are premade to calculate season totals and game averages! This is great for coaches who break down their own film or for educators who want to make statistics fun for students! Includes 19 sheets for individual games and a sheet for season totals and averages.
Grades:
Not Grade Specific
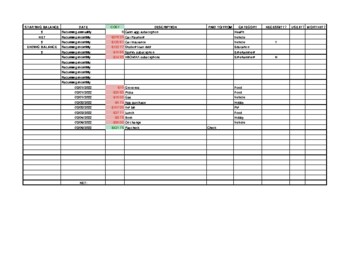
Example expense sheet
Example expense sheet to keep track of finances. Great for all math courses.
Subjects:
Grades:
Not Grade Specific
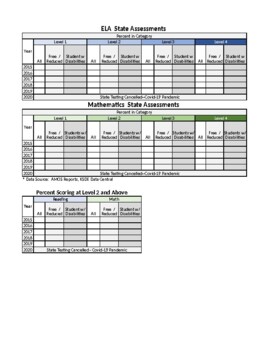
State Comparison Data Chart
Save time with this chart that compiles tens of pages into one, easy to read chart. Perfect to use when reporting school performance to the local Board of Education or copied into a district newsletter to staff.
Grades:
Not Grade Specific
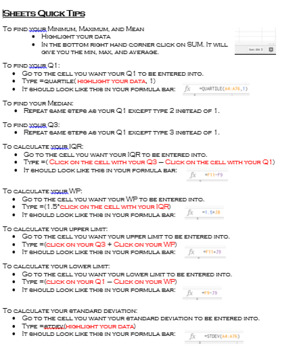
Google Sheets Quick Tips
Here are some quick tips on how to find a five number summary in Google Sheets.
Subjects:
Grades:
Not Grade Specific
Types:
Showing 1-11 of 11 results


