90 results
Not grade specific statistics microsofts
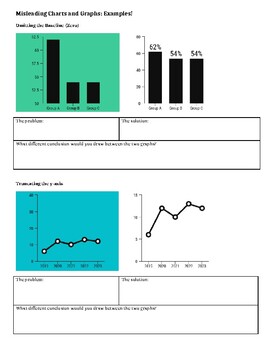
Misleading Charts and Graphs Analysis
This lesson outlines the four most common ways that writers and journalists display graphs that can cause people to draw incorrect conclusions. Students look at examples of bad graphs along with corrected versions and explain why one version is misleading and the other is correct. Independent practice is provided for the students to demonstrate understanding as well.
Subjects:
Grades:
Not Grade Specific
Types:
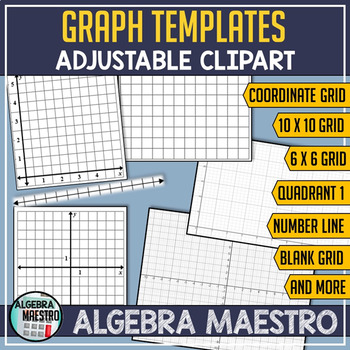
Adjustable Graph Templates
With Adjustable Graph Templates you'll receive a variety of graphs that are formatted to be easily adjustable, this is to help you create your own assignments. The full-page templates can be used as cut-outs, very useful for Foldables, and Interactive Notebooks. There are a variety of graph templates: coordinate axis (axes), 1st quadrant, number line, grid - and with a variety of units and sizes to suit your needs. To adjust a graph - click the desired graph and adjust the size by selecting-
Subjects:
Grades:
Not Grade Specific
Types:
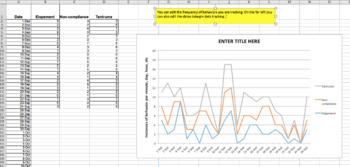
More Graphs Added! Graphing Basic Data For Students: An Excel Workbook
This is a great resource to use for data tracking for all of your students or clients. I have expanded the other Graphic Workbook on my TPT store. This resource is made to easily create graphs for a variety of skills or behaviors. As a result, this excel workbook can be used by teachers, behavior analysts, speech therapists, behavior intervention specialists, really anyone who needs data collection. The graphs can be shared during parent-teacher conferences, IEP meetings, included in student pro
Subjects:
Grades:
Not Grade Specific
Types:
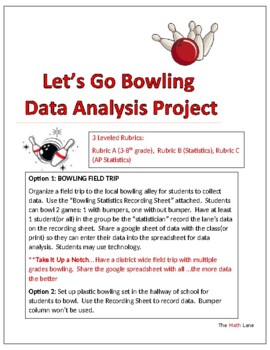
Let's Go Bowling Statistics STEM Project & Field Trip (3-12 and AP Stat)
Great END OF YEAR project. Get ready to strike up some fun with your students on a field trip to the bowling alley or right in your own hallway with a plastic bowling set! This isn't just any ordinary field trip - it's a real-world data collection extravaganza. 3 different leveled rubrics (Grade 4-10, Statistics, AP Statistics) so students can analyze the data based on their math knowledge. Students will be able to practice creating and analyzing graphical displays, scatterplots, construct c
Subjects:
Grades:
Not Grade Specific
Types:
Also included in: High School Statistics Project Bundle
Intro to Data Analysis Interactive Lesson *Any Level* Mean, Median, Mode & Range
Are you introducing your students to concepts like data sets, mean, median, and mode?Do you want your students to actually understand the meaning of these terms, not just see them as meaningless, unimportant, abstract words in a math textbook?Do you want your students to understand that calculating mean, median, mode, and range is actually useful, not just pointless math exercises?This may be the perfect lesson for you!This lesson is fully complete and ready to use, based on well-researched peda
Subjects:
Grades:
Not Grade Specific

Guerre des clans!
Plongez-vous dans l'excitation d'un jeu télévisé avec cette adaptation palpitante du célèbre Duel de Questions ! Dans ce jeu interactif, deux équipes s'affrontent pour trouver les réponses les plus populaires à une série de sondages. Vous recevrez un fichier PowerPoint contenant 25 sondages, chacun présenté sous forme de rectangles bleus à cliquer pour révéler les réponses. ATTENTION! Assurez-vous d'avoir les feuilles de réponses des sondages à portée de main pour ouvrir les bonnes cases !Règles
Subjects:
Grades:
Not Grade Specific
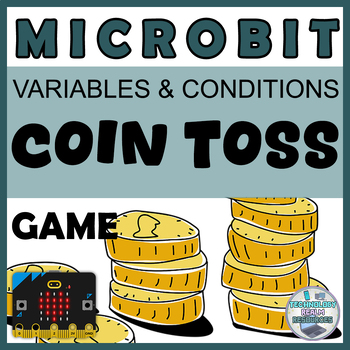
Microbit BEGINNER Coin toss project variables and conditions coding
This resource is about the popular coin toss game and how the students, with the help of a little microbit block coding (variables, conditions, comparators, random numbers, on button press event), can recreate the game and enjoy their time while learning.The Micro:bit circuit board is nothing without some fun activities and games that show how cool programming and coding can be! This is exactly why I am here - to help educators all around the world in their quest for fun Micro:bit activities and
Grades:
Not Grade Specific
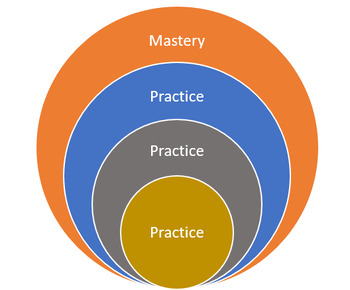
Statistics Multiple Choice Exams; Randomized & Preselected Qs
These are the available tests.Statistics Review (40 Random Qs)Multiple Choice Exam 01 (40 Preselected Qs)Multiple Choice Exam 02 (40 Preselected Qs)Multiple Choice Exam 03 (40 Preselected Qs)The download will have the URL, username, and password to the Canvas online testing system.After you log in, you will be able to take the stats assessmentsYour account will stay active for 6 monthsIf you use Canvas as your testing platform, this quiz can be installed, administered, will self-grade, and updat
Subjects:
Grades:
Not Grade Specific
Types:
Critical Thinking | Inductive Arguments + Statistics (PPT)
This Editable Presentation includes:✓ 28 Animated PowerPoint Slides✓ Clear + Organized + Accessible ContentTopics: “Inductive Arguments & Statistics” [FREE READING]ENUMERATIVE INDUCTION Sample Size Representativeness OPINION POLLS ANALOGICAL INDUCTION (arguments by analogy)Relevant Similarities Relevant Dissimilarities The Number of Instances Compared Diversity Among CasesPractice ExamplesGamblers Fallacy + Other Inductive FallaciesRebeka Ferreira's Content:✓ Like & Subscribe on YouTube✓
Grades:
Not Grade Specific
Also included in: Critical Thinking (COMPLETE - PPT Bundle)
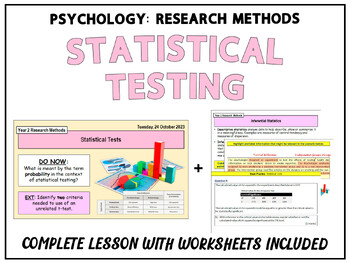
RESEARCH METHODS IN PSYCHOLOGY: Statistical Testing
To request lessons, provide feedback or if you have had any issues opening any resources of my resources, please feel free to contact me on jb_resources@outlook.com (responses are usually very prompt).Key content covered in this Lesson:Key QuestionsDescriptive vs. Inferential StatisticsInferential Statistics in PsychologyStatistical Tests: Wilcoxon, Related t-test, Chi-squared, Mann Whitney, Unrelated t-test, Spearman's Rho, Pearons rLearning the Decision TreeWhen to Use Parametric TestsStatisti
Subjects:
Grades:
Not Grade Specific
Also included in: RESEARCH METHODS IN PSYCHOLOGY [UNIT 2 COMPLETE MODULE]

Real NFL Super Bowl Word Problems
Pictures and 21 real-life historical word problems where students can determine operation to answer statistical problems.
Subjects:
Grades:
Not Grade Specific
Types:
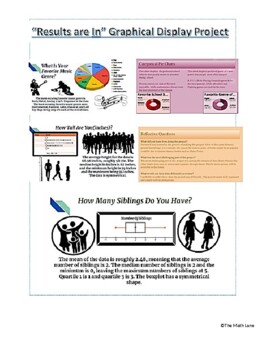
"The Results are In" Graphical Display Stats End of Year Project (All Grades)
Get ready to take your data analysis skills to the next level with our Graphical Display Project! Designed for students who want to create visually stunning displays of their data, this project allows you to not only collect data using Google Surveys, but also analyze and present it using Google Sheets. With detailed instructions, project examples, and a comprehensive rubric included, you'll have everything you need to create professional-looking graphical displays of both numerical and categori
Subjects:
Grades:
Not Grade Specific
Types:
CCSS:
Also included in: High School Math Projects (Algebra II and Statistics) STEM No prep
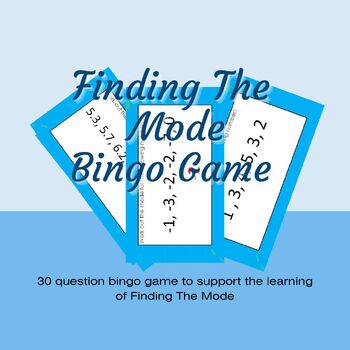
Finding The Mode Maths Bingo Game Activity
OverviewFinding The Mode Maths Bingo Game is an engaging PowerPoint downloadable game/activity designed to help students revise the math topic of finding the mode from a set of data. With 30 adaptable questions and answers included, this game encourages active participation and critical thinking. Students pick 9 numbers at the beginning, and the teacher projects the PowerPoint game, creating an interactive and enjoyable revision session.PowerPoint StructureSlide 2 Table of 30 Answers A table fea
Subjects:
Grades:
Not Grade Specific
Univariate Stats: Frequency Distribution Table, Animated PPT w/ Scaffolded Notes
This Univariate Stats: Frequency Distribution Table resource contains scaffolded note pages that correspond to an interactive PowerPoint for your scientific method or statistics unit. There is a Tip & Tricks slide and corresponding note page that compiles feedback, notes, and helpful information I have personally seen benefit my students.Please be aware that this lesson was designed for a criminal justice-based statistics course; as such, topics and applied word problems use related themes.P
Subjects:
Grades:
Not Grade Specific
CCSS:
NGSS:
HS-LS4-3

Winter Themed Holiday Glyphs
These themed holiday glyphs include an elf, snowman, and reindeer. Use these glyphs as a single lesson on data collection, or refer back to them again and again. These engaging glyphs address skills like following instructions, collaboration, data collection, and analytical skills. Whether you are a seasoned vet with glyphs or trying them for your first time these FULLY CUSTOMIZABLE glyphs can be altered to fit the needs of any class or grade.
Subjects:
Grades:
Not Grade Specific

Data Handling: Traffic Nightmare Tally and Bar Charts Project
A fantastic and very comprehensive resource including a Traffic Nightmare project book, lesson plan, student objective sheets, PowerPoint extended data collection exercise, PowerPoint Tally Chart Bingo, student bingo sheet and a PowerPoint introduction to using tally charts.
This project focuses on a scenario where the opening of a local supermarket has resulted in a great increase in heavy traffic through a residential area. The students tally the vehicles they see on screen to 'prove' the incr
Subjects:
Grades:
Not Grade Specific

Constants, Variables, & Level of Measurement Animated PPT w/ Scaffolded Notes
This constants, variables, and level of measurement resource contains an interactive and animated PowerPoint with matching scaffolded style notes for your scientific method or statistics unit. There is a Tip & Tricks slide and corresponding note page that compiles feedback, notes, and helpful information I have personally seen benefit my students.Please be aware that this lesson was designed for a criminal justice-based statistics course; as such, topics and applied word problems use related
Subjects:
Grades:
Not Grade Specific
CCSS:
NGSS:
HS-LS3-3
5:28
Measures of Spread using Excel Statistics Mathematics (Standard Deviation)
This is a 5 min tutorial on how to use Excel to find IQR and Standard Deviation. I am a qualified Mathematics teacher for over 16 years with a computer science degree. I hope you find this helpful. If you do please follow and leave a review. It really helps my store. Thanks a bunch!
Grades:
Not Grade Specific
Types:
Univariate Stats: Frequency Distribution Table, Animated PPW & Knowledge Checks
This Univariate Statistics: Frequency Distribution Table resource contains an interactive and animated PowerPoint for your scientific method or statistics unit. You can also purchase the matching scaffolded notes. There is a Tip & Tricks slide and corresponding note page that compiles feedback, notes, and helpful information I have personally seen benefit my students.Please be aware that this lesson was designed for a criminal justice-based statistics course; as such, topics and applied word
Subjects:
Grades:
Not Grade Specific
CCSS:
NGSS:
MS-LS4-6
Moneyball (2011) Movie Questions
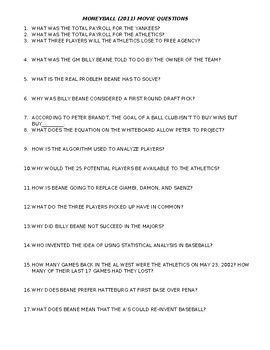
Moneyball (2011) Movie Questions: short response questions that accompany the 2011 film starring Brad Pitt, Moneyball. Questions are in chronological order, and activity would be great for an Economics or Statistics class.
Subjects:
Grades:
Not Grade Specific
Correlation? Data Project (3 Rubrics_Elem/Middle School/ AP Stats) EOY
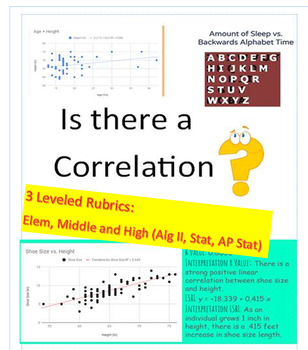
Get ready to supercharge your students' data analysis skills with this dynamic project! Perfect for end of year or semester project. In this engaging activity, students will have the exciting opportunity to collect their own data through surveys, online research, or real world data sets. They will then dive deep into the world of statistics as they determine if there is a correlation between two variables. With three different leveled rubrics, this project is perfect for students of all ages an
Subjects:
Grades:
Not Grade Specific
Types:
CCSS:
Also included in: High School Math Projects (Algebra II and Statistics) STEM No prep
TpT Seller's Journal I Calendars and Monthly Planning
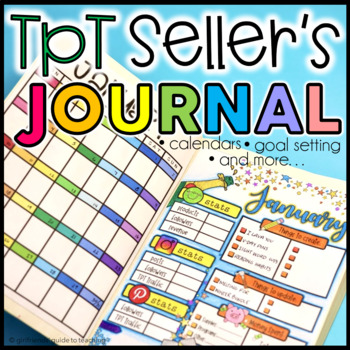
This monthly planner or BULLET JOURNAL is intended to help TpT sellers or ANY SELLER by recording and tracking stats and helping them organize and set goals for each month of the year! This file has a bullet journal style format with fun illustrations and designs for each month of the year. This file also comes with editable pages to create the journal page that best fits your needs.NOTE: There is a PREVIEW available for this file. Please, take a look and see if this activity is a good fit for y
Subjects:
Grades:
Not Grade Specific
Constants, Variables, & Level of Measurement Animated PPW, Knowledge Checks
This constants, variables, and level of measurement resource contains an interactive and animated PowerPoint for your scientific method or statistics unit. You can also purchase the matching scaffolded notes. There is a Tip & Tricks slide and corresponding note page that compiles feedback, notes, and helpful information I have personally seen benefit my students.Please be aware that this lesson was designed for a criminal justice-based statistics course; as such, topics and applied word prob
Subjects:
Grades:
Not Grade Specific
CCSS:
NGSS:
HS-LS3-3
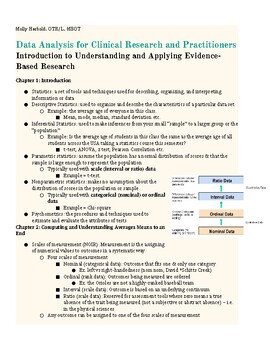
Editable Clinical Research/ Data Analysis Lecture Notes for a Full Semester!
I created this editable lecture material and study guide while taking Data Analysis in graduate school for my master's in occupational therapy. This simple-to-understand guide looks over the basics of research while applying the basics using a clinical lease. This study guide is excellent for all students taking introductory statistics courses, data analysis, or clinical research. The specific graduate programs that would benefit from this include but are not limited to:Occupational TherapyPhysi
Subjects:
Grades:
Not Grade Specific
Types:
Showing 1-24 of 90 results


