53 results
Not grade specific statistics resources for Google Apps
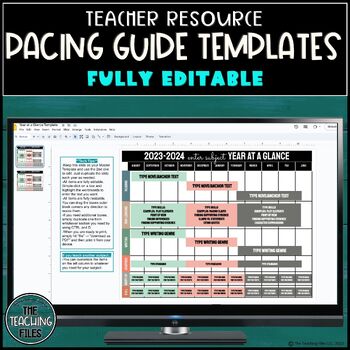
Pacing Guide and Year At A Glance Editable Templates Full Year
These Pacing Guide and Year At A Glance Editable Templates are core to mapping out your school year. Each template is fully editable and customizable for any subject. About This Product:-Google format-2 templates:Daily/Weekly Pacing Guide Year At A Glance -Fully editable-The daily/weekly pacing guide is dated for you from August 2023-July 2024, however, you can adapt dates if needed. -When you download the product, it will AUTOMATICALLY make a copy for you in your Google Drive. All you must do i
Subjects:
Grades:
Not Grade Specific

Teacherpreneur Data Insights - TPT Seller Business Tracker Analysis Spreadsheets
Welcome to Teacherpreneur Data Insights – a business data tracker designed to elevate your teacher seller journey. Gain actionable insights, track trends, and optimize your strategies with this comprehensive tool. In a world where data is powerful, this guidebook and Google Sheets combo empowers you to navigate your TPT store effectively. Seamlessly analyze your metrics, make informed decisions, and propel your store to new heights. Utilize this powerful tool to identify your best-selling produc
Subjects:
Grades:
Not Grade Specific
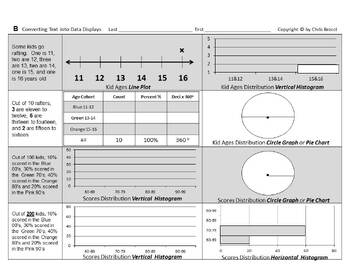
Stats&Data Slides Bundle C: Data Displays Measures of Central Tendency Variation
From the Author of Bossy BrocciMath & Big Science workbooks on Amazon,comes student fillable editable interactiveGoogle Slides™ for Google Classroom™ Students can insert/overlay text & graphics[textboxes, shapes, lines, arrows, colors etc.]onto the G-Slide image backgroundorConvert to PDF, then make it interactive onlineby using various third-party Ed. websitesorPrint it for paper worksheets=======================This Bundle of Data Displays,Measures of Central Tendency(Mean, Median, M
Subjects:
Grades:
Not Grade Specific
Types:
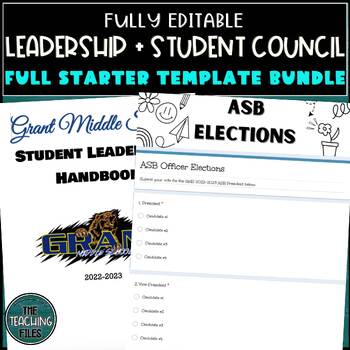
Leadership Student Council Templates Bundle
This Leadership and Student Council ASB bundle includes all logistical documents and resources you will need to get your year started. All of these templates are editable and should be customized to fit your needs. The information on each resource is filled in so that there are examples. However, please keep in mind that specific pages need to be edited to include your school’s name, your name, expectations, dates, etc.About This Product:-Google format-6 templates:ASB Officer HandbookASB Officer
Subjects:
Grades:
Not Grade Specific
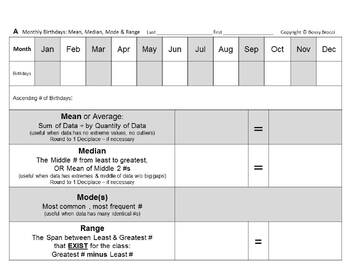
Stats&Data Slides Bundle B: Birthdays Data Displays Variation Mean Median Mode
From the Author of Bossy BrocciMath & Big Science workbooks on Amazon,comes student fillable editable interactiveGoogle Slides™ for Google Classroom™ Students can insert/overlay text & graphics[textboxes, shapes, lines, arrows, colors etc.]onto the G-Slide image backgroundorConvert to PDF, then make it interactive onlineby using various third-party Ed. websitesorPrint it for paper worksheets=======================This Birthdays Stats (Mean, Median, Mode, Range),Measures of Variation &am
Subjects:
Grades:
Not Grade Specific
Types:
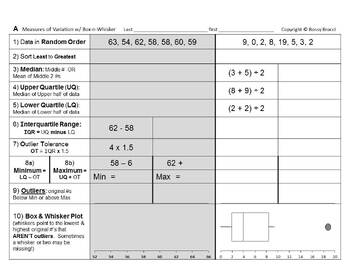
Stats&Data Slides Bundle A: Measures of Variation Box & Whisker Box Plots
From the Author of Bossy BrocciMath & Big Science workbooks on Amazon,comes student fillable editable interactiveGoogle Slides™ for Google Classroom™ Students can insert/overlay text & graphics[textboxes, shapes, lines, arrows, colors etc.]onto the G-Slide image backgroundorConvert to PDF, then make it interactive onlineby using various third-party Ed. websitesorPrint it for paper worksheets=======================This Measures of Variation Box & WhiskerBox Plots Bundlecontains:4 Les
Subjects:
Grades:
Not Grade Specific
Types:
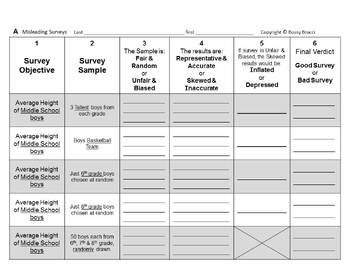
Stats&Data Slides Bundle D: Misleading Misinterpreting Surveys Statistics Graphs
From the Author of Bossy BrocciMath & Big Science workbooks on Amazon,comes student fillable editable interactiveGoogle Slides™ for Google Classroom™ Students can insert/overlay text & graphics[textboxes, shapes, lines, arrows, colors etc.]onto the G-Slide image backgroundorConvert to PDF, then make it interactive onlineby using various third-party Ed. websitesorPrint it for paper worksheets=======================This Bundle onMisleading & MisinterpretingSurveys, Statistics, and Gr
Subjects:
Grades:
Not Grade Specific
Types:
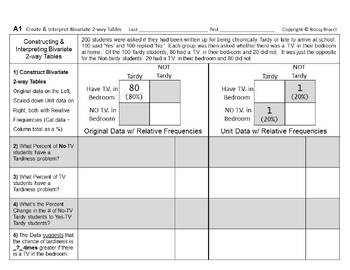
Stats&Data Slides 12: Construct Analyze Bivariate Two-way Frequency Data Tables
From the Author of Bossy BrocciMath & Big Science workbooks on Amazon,comes student fillable editable interactiveGoogle Slides™ for Google Classroom™ Students can insert/overlay text & graphics[textboxes, shapes, lines, arrows, colors etc.]onto the G-Slide image backgroundorConvert to PDF, then make it interactive onlineby using various third-party Ed. websitesorPrint it for paper worksheetsANSWER KEY included=======================Students will:1) Construct a Pair of Raw and Unit/Simpl
Subjects:
Grades:
Not Grade Specific
Types:
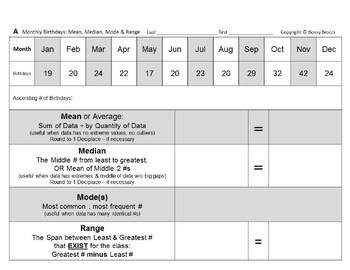
Stats&Data Slides 10: Author Birthdays Variation Central Tendency Data Displays
From the Author of Bossy BrocciMath & Big Science workbooks on Amazon,comes student fillable editable interactiveGoogle Slides™ for Google Classroom™ Students can insert/overlay text & graphics[textboxes, shapes, lines, arrows, colors etc.]onto the G-Slide image backgroundorConvert to PDF, then make it interactive onlineby using various third-party Ed. websitesorPrint it for paper worksheetsAnswer KEY included=======================Students will:1) Convert the given Monthly Birthdaysfro
Subjects:
Grades:
Not Grade Specific
Types:
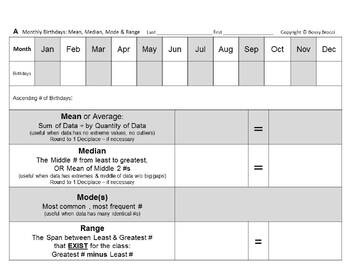
Stats&Data Slides 11: YOUR Birthdays Variation Central Tendency Data Displays
From the Author of Bossy BrocciMath & Big Science workbooks on Amazon,comes student fillable editable interactiveGoogle Slides™ for Google Classroom™ Students can insert/overlay text & graphics[textboxes, shapes, lines, arrows, colors etc.]onto the G-Slide image backgroundorConvert to PDF, then make it interactive onlineby using various third-party Ed. websitesorPrint it for paper worksheets=======================Students will:1) Convert a Monthly Birthdays tallyfrom YOUR School or Clas
Subjects:
Grades:
Not Grade Specific
Types:
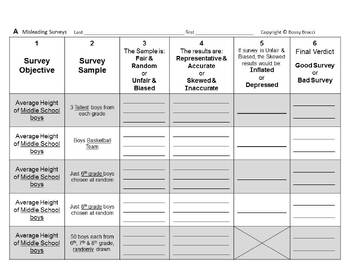
Stats&Data Slides 13: Misleading & Misinterpreting Surveys & Statistics + QUIZ
From the Author of Bossy BrocciMath & Big Science workbooks on Amazon,comes student fillable editable interactiveGoogle Slides™ for Google Classroom™ Students can insert/overlay text & graphics[textboxes, shapes, lines, arrows, colors etc.]onto the G-Slide image backgroundorConvert to PDF, then make it interactive onlineby using various third-party Ed. websitesorPrint it for paper worksheetsANSWER KEY included=======================Students will:1) Read 10 different Surveys and Survey S
Subjects:
Grades:
Not Grade Specific
Types:
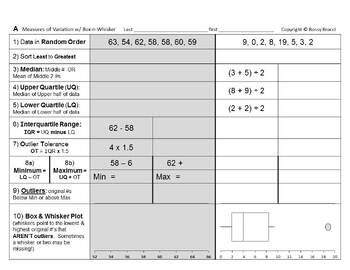
Stats&Data Slides 06: Quartiles Interquartile Range Outliers Box Whisker Plots
From the Author of Bossy BrocciMath & Big Science workbooks on Amazon,comes student fillable editable interactiveGoogle Slides™ for Google Classroom™ Students can insert/overlay text & graphics[textboxes, shapes, lines, arrows, colors etc.]onto the G-Slide image backgroundorConvert to PDF, then make it interactive onlineby using various third-party Ed. websitesorPrint it for paper worksheetsAnswer KEY included=======================Students will:1) Sort or Sequence 8 different Data Sets
Subjects:
Grades:
Not Grade Specific
Types:
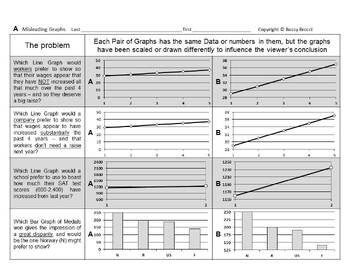
Stats&Data Slides 14: Misleading & Misinterpreting Data Graphs Charts Statistics
From the Author of Bossy BrocciMath & Big Science workbooks on Amazon,comes student fillable editable interactiveGoogle Slides™ for Google Classroom™ Students can insert/overlay text & graphics[textboxes, shapes, lines, arrows, colors etc.]onto the G-Slide image backgroundorConvert to PDF, then make it interactive onlineby using various third-party Ed. websitesorPrint it for paper worksheetsANSWER KEY included=======================Students will:1) Analyze 20 different Graphs or Data Di
Subjects:
Grades:
Not Grade Specific
Types:
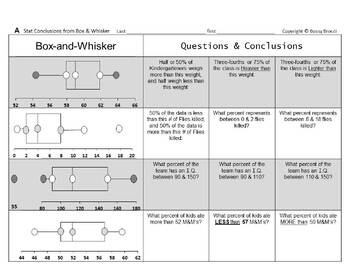
Stats&Data Slides 09: Statistical Conclusions from Box and Whisker Plots QUIZ
From the Author of Bossy BrocciMath & Big Science workbooks on Amazon,comes student fillable editable interactiveGoogle Slides™ for Google Classroom™ Students can insert/overlay text & graphics[textboxes, shapes, lines, arrows, colors etc.]onto the G-Slide image backgroundorConvert to PDF, then make it interactive onlineby using various third-party Ed. websitesorPrint it for paper worksheetsAnswer KEY included=======================Students will:1) Analyze 8 Box & Whisker Plots (Box
Subjects:
Grades:
Not Grade Specific
Types:
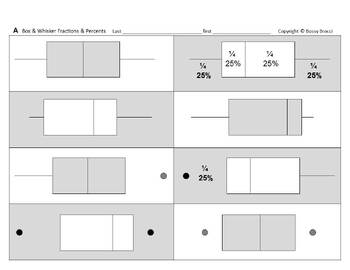
Stats&Data Slides 08: Convert Label Box and Whisker Plots to Fractions Percents
From the Author of Bossy BrocciMath & Big Science workbooks on Amazon,comes student fillable editable interactiveGoogle Slides™ for Google Classroom™ Students can insert/overlay text & graphics[textboxes, shapes, lines, arrows, colors etc.]onto the G-Slide image backgroundorConvert to PDF, then make it interactive onlineby using various third-party Ed. websitesorPrint it for paper worksheetsAnswer KEY included=======================Students will:1) Analyze 16 Box & Whisker Plots (Bo
Subjects:
Grades:
Not Grade Specific
Types:
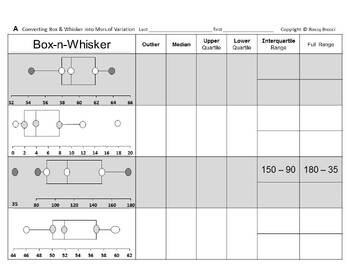
Stats&Data Slides 07: Box Whisker Plots Quartiles Interquartile Range Outliers
From the Author of Bossy BrocciMath & Big Science workbooks on Amazon,comes student fillable editable interactiveGoogle Slides™ for Google Classroom™ Students can insert/overlay text & graphics[textboxes, shapes, lines, arrows, colors etc.]onto the G-Slide image backgroundorConvert to PDF, then make it interactive onlineby using various third-party Ed. websitesorPrint it for paper worksheetsAnswer KEY included=======================Students will:1) Analyze 8 Box & Whisker Plots (Box
Subjects:
Grades:
Not Grade Specific
Types:
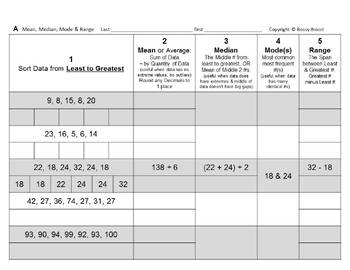
Stats&Data Slides 05: Calculate Measures Central Tendency Mean Median Mode Range
From the Author of Bossy BrocciMath & Big Science workbooks on Amazon,comes student fillable editable interactiveGoogle Slides™ for Google Classroom™ Students can insert/overlay text & graphics[textboxes, shapes, lines, arrows, colors etc.]onto the G-Slide image backgroundorConvert to PDF, then make it interactive onlineby using various third-party Ed. websitesorPrint it for paper worksheetsAnswer KEY included=======================Students will:1) Calculate Mean, Median, Mode and Range
Subjects:
Grades:
Not Grade Specific
Types:
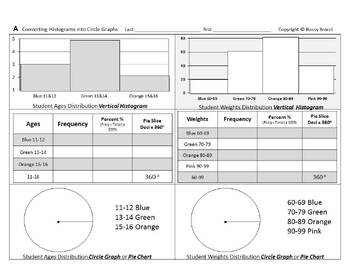
Stats&Data Slides 03: Convert Histograms into Circle Graphs Construct Pie Charts
From the Author of Bossy BrocciMath & Big Science workbooks on Amazon,comes student fillable editable interactiveGoogle Slides™ for Google Classroom™ Students can insert/overlay text & graphics[textboxes, shapes, lines, arrows, colors etc.]onto the G-Slide image backgroundorConvert to PDF, then make it interactive onlineby using various third-party Ed. websitesorPrint it for paper worksheetsAnswer KEY included=======================Students will:1) Convert 3 Vertical Histograms into3 Da
Subjects:
Grades:
Not Grade Specific
Types:
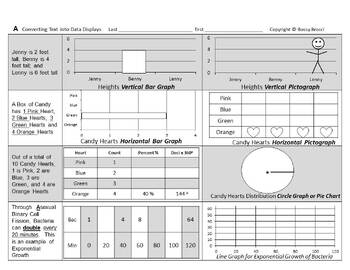
Stats&Data Slides 02: Convert Text & Create Construct Ten Types of Data Displays
From the Author of Bossy BrocciMath & Big Science workbooks on Amazon,comes student fillable editable interactiveGoogle Slides™ for Google Classroom™ Students can insert/overlay text & graphics[textboxes, shapes, lines, arrows, colors etc.]onto the G-Slide image backgroundorConvert to PDF, then make it interactive onlineby using various third-party Ed. websitesorPrint it for paper worksheetsAnswer KEY included=======================Students will:1) Read 8 Word Problems and Convert text
Subjects:
Grades:
Not Grade Specific
Types:
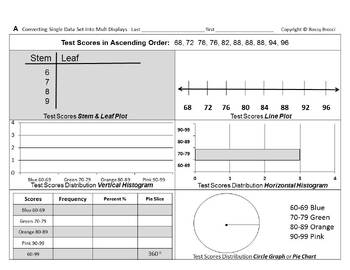
Stats&Data Slides 04: Convert Data Sets Create Construct 6 Types Data Displays
From the Author of Bossy BrocciMath & Big Science workbooks on Amazon,comes student fillable editable interactiveGoogle Slides™ for Google Classroom™ Students can insert/overlay text & graphics[textboxes, shapes, lines, arrows, colors etc.]onto the G-Slide image backgroundorConvert to PDF, then make it interactive onlineby using various third-party Ed. websitesorPrint it for paper worksheetsAnswer KEY included=======================Students will:1) Convert 2 Different Data Sets or Sets
Subjects:
Grades:
Not Grade Specific
Types:
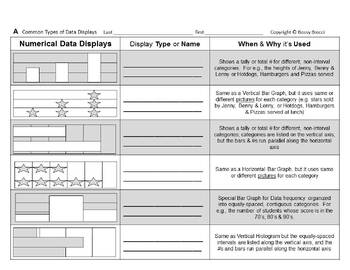
Stats&Data Slides 01: Identify & Select Common Types of Data Displays
From the Author of Bossy BrocciMath & Big Science workbooks on Amazon,comes student fillable editable interactiveGoogle Slides™ for Google Classroom™ Students can insert/overlay text & graphics[textboxes, shapes, lines, arrows, colors etc.]onto the G-Slide image backgroundorConvert to PDF, then make it interactive onlineby using various third-party Ed. websitesorPrint it for paper worksheetsAnswer KEY included=======================Students will:1) Identify and Label various Data Displa
Subjects:
Grades:
Not Grade Specific
Types:
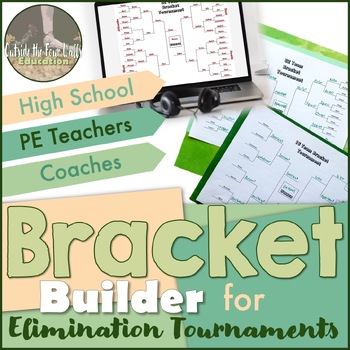
Bracket Builder for Tournaments
Looking to bring some friendly competition in your curriculum? Use these editable brackets to bring a tournament into your classroom! These editable brackets will self-populate based on the order you rank your teams. This is a great opportunity to teach about statistics and probability in real-life situations. In this spreadsheet, you will get:Linked spreadsheets so your data can be filled in on one spreadsheet and auto-populate on the bracket of choice.2 different 16 team brackets – one standar
Grades:
Not Grade Specific
Critical Thinking | Inductive Arguments + Statistics (PPT)
This Editable Presentation includes:✓ 28 Animated PowerPoint Slides✓ Clear + Organized + Accessible ContentTopics: “Inductive Arguments & Statistics” [FREE READING]ENUMERATIVE INDUCTION Sample Size Representativeness OPINION POLLS ANALOGICAL INDUCTION (arguments by analogy)Relevant Similarities Relevant Dissimilarities The Number of Instances Compared Diversity Among CasesPractice ExamplesGamblers Fallacy + Other Inductive FallaciesRebeka Ferreira's Content:✓ Like & Subscribe on YouTube✓
Grades:
Not Grade Specific
Also included in: Critical Thinking (COMPLETE - PPT Bundle)
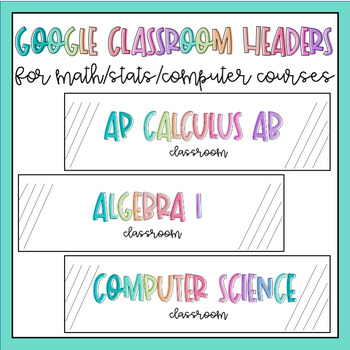
Google Classroom Headers for Math, Stats, and Computer Science Courses!
Need a cute header for your google classroom? This product contains 33 different png images that can be upload to google classroom as the header photo. (Now includes BOTH transparent and white backgrounds for all courses!)The following courses are included:Algebra 1Algebra 2Algebra 3AP Calculus ABAP Calculus BCAP Computer Science PrinciplesAP StatisticsCalculusCollege AlgebraComputer ScienceGeometryHonors Algebra 1Honors Algebra 2Honors GeometryIntegrated Math 1Integrated Math 2Integrated Math 3
Subjects:
Grades:
Not Grade Specific
Types:
Showing 1-24 of 53 results


