35 results
High school statistics interactive notebook microsofts
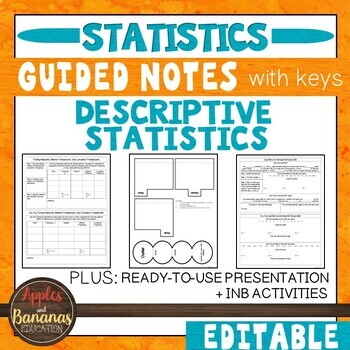
Descriptive Statistics- Guided Notes, Presentation, and INB Activities
This Introduction to Statistics product is flexible, editable, and can be used for in-person or distance learning. Take the time and stress out of creating your own guided notes and presentations. There are many ways to use this engaging bundle. It includes guided notes embedded with student practice problems (keys included), foldable activities, and a PowerPoint presentation for focused instruction. Choose what works best for your class/student and modify to make the content fit your needs. Not
Subjects:
Grades:
9th - 12th
CCSS:
Also included in: Custom Bundle for Viet
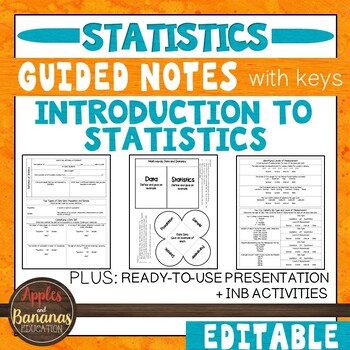
Introduction to Statistics - Guided Notes, Presentation, and INB Activities
This Introduction to Statistics product is flexible, editable, and can be used for in-person or distance learning. Take the time and stress out of creating your own guided notes and presentations. There are many ways to use this engaging bundle. It includes guided notes embedded with student practice problems (keys included), foldable activities, and a PowerPoint presentation for focused instruction. Choose what works best for your class/student and modify to make the content fit your needs. Not
Subjects:
Grades:
9th - 12th
CCSS:
Also included in: Custom Bundle for Viet
Probability Algebra 2
This bundle of resources for Algebra 2 Unit 10 Probability is available at a discount for a limited time. Included in this bundle (when it is finished):- Color-coded graphic organizers on probability topics listed below- Black-line master graphic organizers on probability topics listed below- Color coded notes with examples- Practice problems (good for homework)- Answer key for practice problems- 2 projects for assessment- Paper chain, card sort, task cards and more for additional practice- Sug
Subjects:
Grades:
10th - 12th
CCSS:
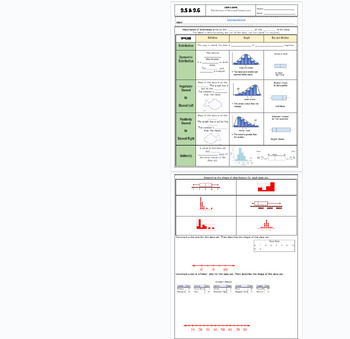
Data Distribution positive/negative skewed fillable notes UPDATED
Unit 9: Data and Stats: Updated(No 9.3/ Skip)9.5/9.6 Data Distribution (skewness)Students go over the vocabulary and complete the examples with the vocabulary scaffolded. Skewness is explained and how to identify it comparing data charts and box and whisker plots. Uses many visuals and examples to differentiate between that different graphs. Notes are scaffolded. Includes hook video hyperlinked on the "learning objective" title. Key is included and hyperlinked as a PDF in the heading highlighted
Subjects:
Grades:
6th - 12th, Higher Education, Adult Education
CCSS:
Also included in: Unit 9: Data and Statistics Fillable Notes
Standard Deviation Fillable Notes UPDATED
Unit 9: Data and Stats: Updated(No 9.3/ Skip)9.4 B Standard DeviationStudents go over the vocabulary and complete the examples with the vocabulary scaffolded. Standard deviation is long hand calculated by showing each step of the process (difference of squares). Real-world examples are explained in notes before calculating to show the importance of this stat and why it is used so often to verify valuable and effective data. Notes are scaffolded. Includes hook video hyperlinked on the "learning o
Subjects:
Grades:
7th - 12th, Higher Education, Adult Education
CCSS:
Also included in: Unit 9: Data and Statistics Fillable Notes
Statistics: Package of all PowerPoints and Interactive Math Notebook
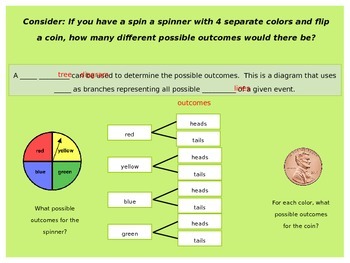
This zip file includes all seven of my PowerPoint and math interactive notebook pages that correspond with each PowerPoint. The topics include fundamental counting principle, permutations, combinations, probability, odds, mutually exclusive and inclusive events, and independent and dependent events. Each can be purchased separately for $2 each, but there is a savings in buying the entire package together.
Subjects:
Grades:
6th - 9th
Correlation, Causation, and r PPT for notes (GSE Algebra 1)
This is the PowerPoint that goes along with Correlation, Causation, and r NOTES for interactive notebook. **It is editable for you to modify to your liking.
Subjects:
Grades:
7th - 10th
Also included in: Algebra 1 Interactive Notebook Notes - BUNDLE!!
Accuracy & Precision Presentation & Notes | Print | Digital | Distance Learning
Engage your students in more ways than before. With three differentiated notes options designed for a binder or an interactive notebook and a teacher-led or self-paced presentation, you have so many options to help your students master ACCURACY, PRECISION, PERCENT ERROR, and STANDARD DEVIATION. Also included are iPDF versions of the student notes that allow your students to complete their notes directly on the computer.Teacher-Led Presentation - Whether in a whole-group or small-group format, th
Subjects:
Grades:
8th - 11th
Also included in: Introduction to Science Presentations and Notes BUNDLE

Unit 1 Bundle
This bundle includes the following foldables and PowerPoints:
Unit 1 Table of Contents
Unit 1 Objectives
PowerPoint 1.0 Intro to Stats
Statistical Vocabulary
Categorical vs. Numerical
PowerPoint 1.1 Analyzing Categorical Data
Categorical Displays
Describing Categorical Data
Marginal & Conditional Distributions
Segmented Bar Charts
PowerPoint 1.2 Displaying Quantitative Data with Graphs
Numerical graphs
Histograms
Dotplots
Stemplots
Boxplots
PowerPoint 1.3 Describing Quantitative
Subjects:
Grades:
9th - 12th
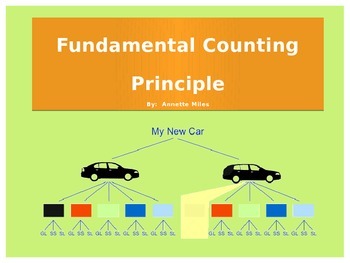
Statistics: Fundamental Counting Principle
This zip file includes a PowerPoint and a student math interactive notebook page to fill out while viewing the PowerPoint. It gives an explanation on how to solve problems according to the fundamental counting principle, gives students opportunities to draw tree diagrams, and has several examples for students to try to solve according to this principle
Subjects:
Grades:
6th - 9th
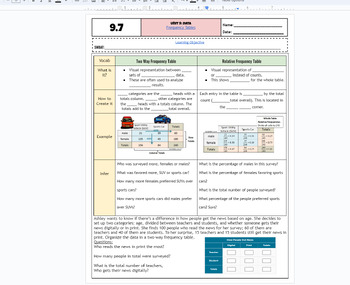
Frequency Tables & Relative Frequency Tables fillable notes UPDATED
Unit 9: Data and Stats: Updated(No 9.3/ Skip)9.7 Frequency Tables Students go over the vocabulary and complete the examples with the vocabulary scaffolded. Students examine a categorical table/frequency table and also use that information to create relative frequency tables. Different real-world examples and problems are used. Emphasized how percents and decimals are calculated. Notes are scaffolded. Includes hook video hyperlinked on the "learning objective" title. Key is included and hyperli
Subjects:
Grades:
6th - 12th, Higher Education, Adult Education
CCSS:
Also included in: Unit 9: Data and Statistics Fillable Notes
Statistics: Mutually Exclusive and Inclusive Events
This zip file includes a 9 slide PowerPoint and a student math interactive notebook page to fill out while viewing the PowerPoint. It gives an explanation on how to solve both exclusive and inclusive probabilities with problems for the students to solve.
Subjects:
Grades:
6th - 9th
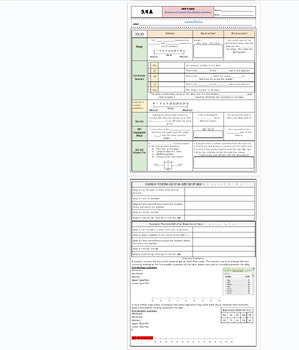
5 Number Summary and Box and Whisker Plots Fillable Notes UPDATED
Unit 9: Data and Stats: Updated(No 9.3/ Skip)9.4 A 5-number summary and box and whisker plot Students go over the vocabulary ad complete the examples with the vocabulary scaffolded. for each statistic with an explanation of the purpose of the 5 number summary and why these are used. Notes are scaffolded. Includes hook video hyperlinked on the "learning objective" title. Key is included and hyperlinked as a PDF in the heading highlighted in the orange box, and at the bottom of the google doc as w
Subjects:
Grades:
6th - 12th, Higher Education, Adult Education
CCSS:
Also included in: Unit 9: Data and Statistics Fillable Notes
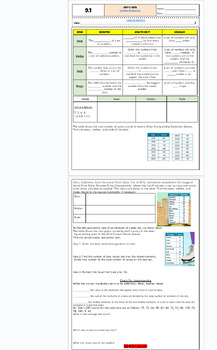
Central Tendencies: Mean, Median and Mode fillable notes: Updated
Unit 9: Data and Stats Updated9.1 Central Tendencies: mean median and modeStudents go over the vocabulary and how to find each average with examples. Notes are scaffolded. Includes hook video hyperlinked on the "learning objective" title. Key is included and hyperlinked as a PDF in the heading highlighted in the orange box, and at the bottom of the google doc as well. Google doc is editable, used in M1 HS
Subjects:
Grades:
6th - 12th, Higher Education, Adult Education
CCSS:
Also included in: Unit 9: Data and Statistics Fillable Notes
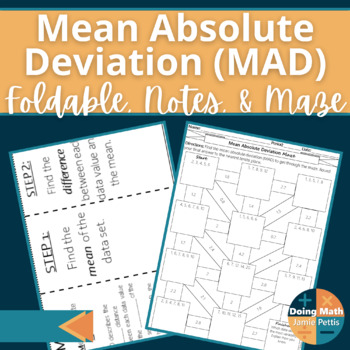
Mean Absolute Deviation (MAD) Foldable Notes and Activities
Everything you need for a complete lesson on calculating the Mean Absolute Deviation (MAD) of a data set. What is included:1. An EDITABLE PowerPoint that corresponds to the foldable notes. There are also three extra practice problems included in the PowerPoint to use as whole group guided practice or for small groups that still need help during independent practice.2. The foldable included allows students to see each step for finding the MAD and provides space to complete the step under each fla
Subjects:
Grades:
9th - 12th
CCSS:
Also included in: Algebra 1 Foldable Notes Activity Bundle

Statistics
Powerpoint covering;-Statistical terms-Bias-Data skews-Standard deviation-Z-scores-Standard scores
Subjects:
Grades:
9th - 12th, Higher Education, Adult Education, Staff
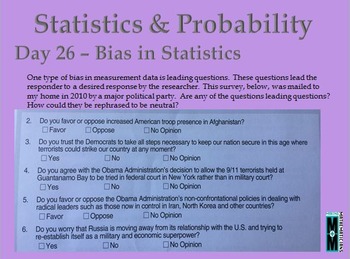
Statistics and Probability Daily Math Slides
These 35 slides focusing on Statistics and Probability are intended to show students the beauty and inter-connectedness of mathematics. These slides can be used as warm-ups or bell ringers or to launch a lesson. Each slide could lead to an extended project or math center. The slides are appropriate for grades 3-12 because they are open-ended or have animation geared to different grade levels. If you purchase all 5 strands of daily math slides you can buy it for a reduced bundled price of $20
Subjects:
Grades:
3rd - 12th
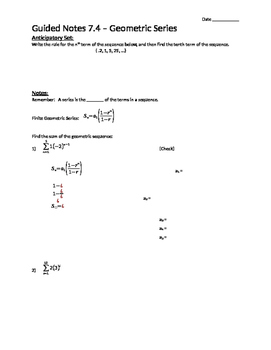
Geometric Series - Notes
Guided notes teaching students how to find the sum of finite and infinite geometric series written in sigma form as well as just in series form. The notes end with a real-world word problem. I also have a corresponding assignment of the same name.
Subjects:
Grades:
9th - 12th, Higher Education, Adult Education
Types:
Statistics: Combinations
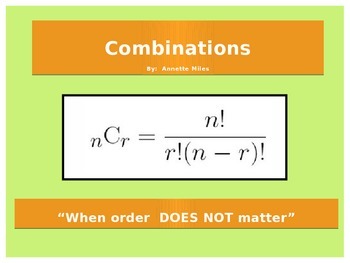
This zip file includes a 20 slide PowerPoint and a student math interactive notebook page to fill out while viewing the PowerPoint. It gives an explanation on how to solve combination problems, allows students to distinguish permutations from combinations, gives students opportunities to solve problems involving combinations, and has several examples for students to try to solve using the combination equation.
Subjects:
Grades:
6th - 9th
Statistics: Dependent Events
This zip file includes a 10 slide PowerPoint and a student math interactive notebook page to fill out while viewing the PowerPoint. It gives an explanation on how to solve dependent events (probability). There are several problems that are explained step by step and several for students to solve independently.
Subjects:
Grades:
6th - 9th
AP Statistics Learning Cards - Unit 1
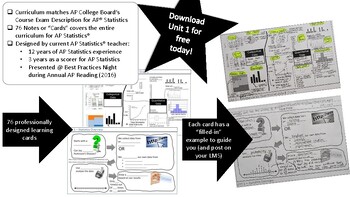
AP Statistics' Learning Cards for Unit 1 are professionally designed fill-in-the-blank cards that match the AP Statistics Course Description6 cards in unit 1Word documents provide 2 different formats to present to studentsPowerPoint presentation fileAll documents are editable
Subjects:
Grades:
9th - 12th
Measure of Position
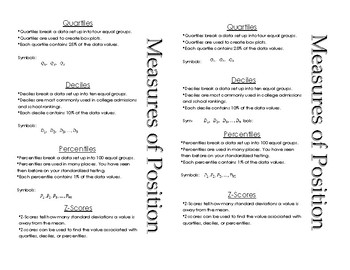
This is a basic outline of quartiles, deciles, percentiles, and z-scores. I use this when I introduce measures of position to my Probability and Statistics classes. We glue it into our Interactive Notebook and include a sample problem to go with each one.
Subjects:
Grades:
11th - 12th
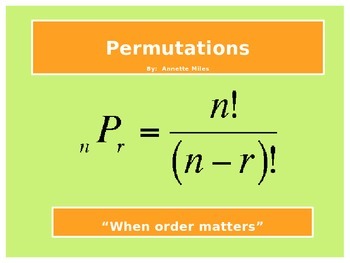
Statistics: Permutations
This zip file includes a 19 slide PowerPoint and a student math interactive notebook page to fill out while viewing the PowerPoint. It gives an explanation on how to solve permutation problems, gives students opportunities to solve problems involving permutations, and has several examples for students to try to solve using the permutation equation.
Subjects:
Grades:
6th - 9th
Statistics: Independent Events
This zip file includes an 11 slide PowerPoint and a student math interactive notebook page to fill out while viewing the PowerPoint. It gives an explanation on how to solve independent events (probability). There are several problems that are explained step by step and several for students to solve independently.
Subjects:
Grades:
6th - 9th
Showing 1-24 of 35 results


