Two Way Frequency Tables and Relative Frequency Notes
MATH with Pink Ink
436 Followers
Grade Levels
8th - 10th
Subjects
Resource Type
Standards
CCSS8.SP.A.4
CCSSHSS-ID.B.5
Formats Included
- Zip
Pages
10 pages
MATH with Pink Ink
436 Followers
Description
NEW AND UPDATED FORMAT*
After careful study I am reformatting my notes to be easier to understand and be better resources for students. They will also more directly address the Common Core standards, and more specifically the Math Florida Standards (my home state).
I have designed this listing to directly address the listed standard for 8th grade, but it could be used in any grade covering frequency tables and relative frequency.
This PDF document contains:
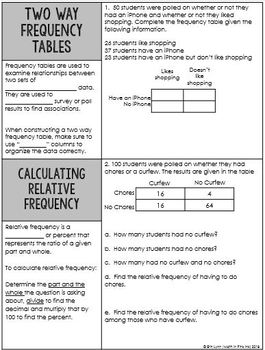
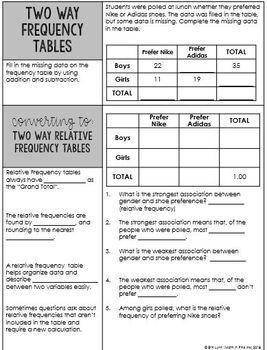
1. Guided, two-column notes format that is great for struggling learners while still being rigorous and standards based.
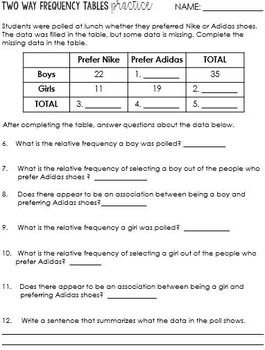
2. 2 Homework/Practice pages.
I have used each PINK INK product in my own classroom and made necessary edits as I saw fit. Please use in your classroom and leave feedback to earn TPT credits!
Why see red when you can use PINK INK!?
Erin Lynn
This activity and all of its parts were designed and created by me through personal study, training, and years of experience. This license is FOR ONE TEACHER. If you would like to purchase this product for your school or department please contact me directly at mrserinlynn@gmail.com and I will create a school license or bundle of licenses for you.
Total Pages
10 pages
Answer Key
Included
Teaching Duration
2 hours
Report this resource to TPT
Reported resources will be reviewed by our team. Report this resource to let us know if this resource violates TPT’s content guidelines.
Standards
to see state-specific standards (only available in the US).
CCSS8.SP.A.4
Understand that patterns of association can also be seen in bivariate categorical data by displaying frequencies and relative frequencies in a two-way table. Construct and interpret a two-way table summarizing data on two categorical variables collected from the same subjects. Use relative frequencies calculated for rows or columns to describe possible association between the two variables. For example, collect data from students in your class on whether or not they have a curfew on school nights and whether or not they have assigned chores at home. Is there evidence that those who have a curfew also tend to have chores?
CCSSHSS-ID.B.5
Summarize categorical data for two categories in two-way frequency tables. Interpret relative frequencies in the context of the data (including joint, marginal, and conditional relative frequencies). Recognize possible associations and trends in the data.


