Bundle - Help with Science Fair Table, Graphs, Statistics using Excel.
LsotoTeach
1 Follower
Grade Levels
9th - 12th
Subjects
Resource Type
Formats Included
- Zip
- Excel Spreadsheets
Pages
6 pages
LsotoTeach
1 Follower
Products in this Bundle (4)
Description
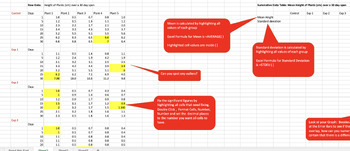
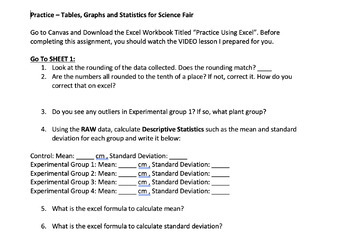
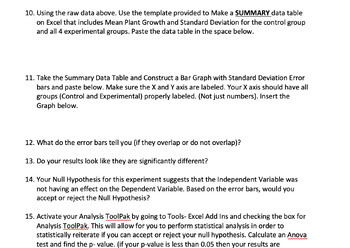
This comprehensive 3-part bundle comprises a video tutorial, an informative handout, and an Excel file meticulously guiding students through a step-by-step process. The aim is to empower students with the skills to transform raw data into concise summative data tables and graphs, complete with standard deviation error bars. The tutorial covers the entire spectrum – from utilizing Excel for table and graph preparation to conducting statistical analyses using Anova tests, t-tests, or correlation methods. By the end of this bundle, students will not only master the technical aspects but also gain a deep understanding of how to interpret and derive meaningful insights from their data.
Total Pages
6 pages
Answer Key
N/A
Teaching Duration
1 hour
Report this resource to TPT
Reported resources will be reviewed by our team. Report this resource to let us know if this resource violates TPT’s content guidelines.


