24 results
3rd grade statistics resources for Easel Activities
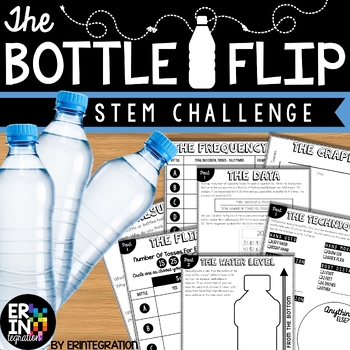
Water Bottle Flip STEM Challenge + STEM Activity
The ORIGINAL water bottle flip STEM activity and lab! Water bottle flip at school? Absolutely! Students will love this on-trend STEM challenge inspired by the popular YouTube water bottle flipping challenge where students toss a water bottle and attempt to land it straight up. Practice scientific method with some probability, fractions and data collection in the mix while having fun!This self-paced, low-prep, project based learning water bottle flip STEM challenge is print-and-go. Each activit
Subjects:
Grades:
3rd - 6th
Types:
CCSS:
NGSS:
K-2-ETS1-2
, K-2-ETS1-3
, MS-ETS1-2
, K-2-ETS1-1
, 3-5-ETS1-3
...
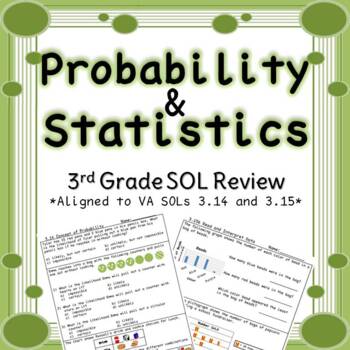
Third Grade Probability and Graphing Review
Now aligns to the new 2016 VA SOLs. This product is a 5 page practice packet/mixed review that aligns to 3rd grade VA Math SOLs. It covers all the SOLs in the 3rd grade Probability/Statistics Strand, including the following math topics:-Collecting Data-Organizing Data-Representing Data-Interpreting Data-Bar Graphs-Picture Graphs-Probability-CombinationsAn answer key is included for each page. This product can be used as whole group practice, small group practice, independent practice, remediatio
Subjects:
Grades:
2nd - 4th
Types:
Also included in: Third Grade Math SOL Review Bundle
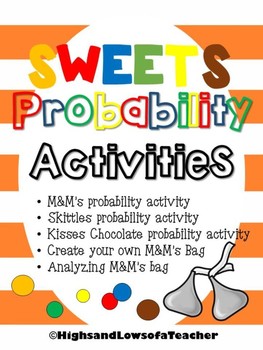
Sweets Probability Activities (chocolate, candy, M&Ms, Skittles, Kisses)
Uses chocolates or candy (M&Ms, Skittles, Kisses) to practice probability!
What's included-
*Colored candy probability activity: have students randomly pick colored candy and tally what's picked to experiment probability
*Colored candy probability activity reflection page- have students reflect on the experiment and explain their thinking
*M&M's probability activity: have students figure out how many M&M's are in a bag and what color of each by using probability
*M&M's probabil
Subjects:
Grades:
2nd - 8th
Types:
Also included in: Probability Activity BUNDLE
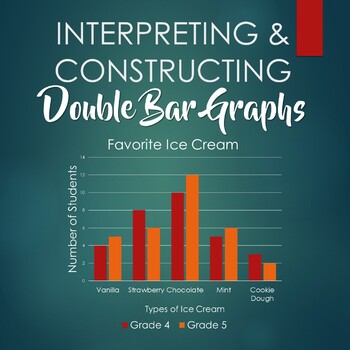
Interpreting and Constructing Double Bar Graphs - Booklet
This booklet includes six worksheets:- 3 double bar graphs for students to interpret- 3 sets of data for students to construct double bar graphs, with corresponding questions- answer key
Subjects:
Grades:
3rd - 6th
Types:
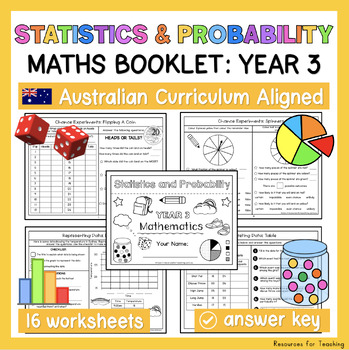
YEAR 3 Statistics and Probability Worksheets and Booklet - Australian Curriculum
This printable booklet includes 16 engaging worksheets to support Year 3 students learning about Statistics and Probability in the Mathematics syllabus. Plenty of outcomes are covered within this resource to save you time prepping activities for your students! The main topics covered within this resource and strand of learning include: chance and data representation & interpretation✩ ALL Year 3 Australian Curriculum Maths Outcomes are linked to this 'Statistics and Probability' booklet.✩ Inc
Subjects:
Grades:
3rd
Types:
Also included in: YEAR 3 Maths Booklet Bundle - Australian Curriculum Outcomes
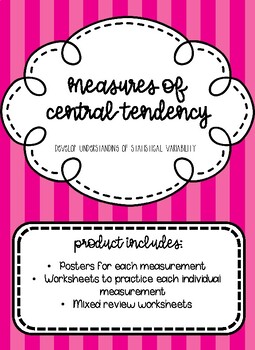
Finding Mean, Median, Mode, and Range
Simple worksheets (5 problems each) to introduce and practice finding the mean, median, mode, and range of a data set. Have students complete with or without calculator, depending on their instructional level. Product includes:-Reference posters for mean, median, mode, and range. Each poster includes the measures' definitions and directions for how to find them with an example.-5 worksheets about finding the mean.-5 worksheets about finding the median.-5 worksheets about finding the mode.-5 work
Subjects:
Grades:
1st - 12th
Types:
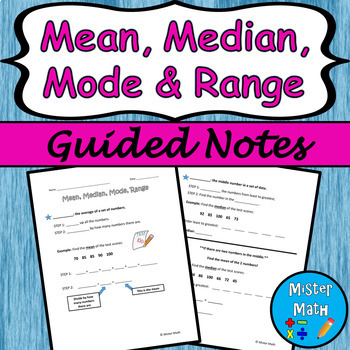
Mean, Median, Mode & Range Guided Notes
This is a guided notes resource to assist students in learning about finding the mean, median, mode, and range of data sets. The guided notes include definitions, as well as a guided example for each skill. An independent practice worksheet is included that asks students to find the mean, median, mode and range for four data sets (for a total of 16 extra practice problems!) An answer key is also provided.This Guided Notes packet is also part of a BUNDLE that includes a PowerPoint presentation to
Subjects:
Grades:
3rd - 6th
Also included in: Mean, Median, Mode & Range PPT and Guided Notes BUNDLE
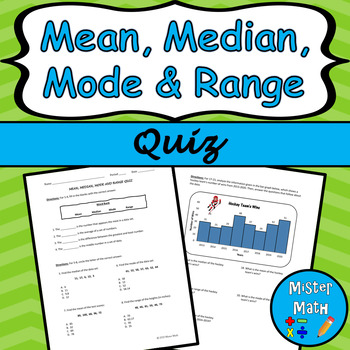
Mean, Median, Mode & Range Quiz
Assess your students' knowledge and skills in finding mean, median, mode and range with this 21-question quiz! The quiz includes fill-in-the-blank, multiple choice, and open-response questions, as well as real-life applications. Students will also be asked to analyze data tables and a bar chart, and calculate the mean, median, mode and range of each data set. An optional challenge activity is included, in which students will be asked to create a data set of their own, place that data into a tabl
Subjects:
Grades:
3rd - 6th
Also included in: Mean, Median, Mode & Range MEGA BUNDLE
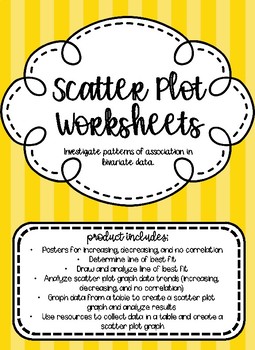
Scatter Plot Graph Worksheets
A collection of worksheets to use when teaching how to investigate patterns of association in bivariate data. Product includes 3 posters for students to reference how to determine if data is increasing, decreasing, or has no correlation. Types of worksheets include:
-Determine line of best fit
-Draw and analyze line of best fit
-Analyze scatter plot graph data trends (increasing, decreasing, and no correlation)
-Graph data from a table to create a scatter plot graph and analyze results
-Use reso
Subjects:
Grades:
1st - 12th
Types:
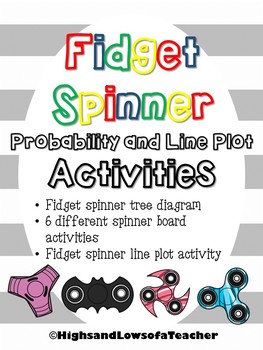
Fidget Spinner Math (line plot, probability, tree diagram)
Use these fidget spinner math activities to engage students in their learning!
What's included-
*Fidget spinner probability tree diagram
*6 different spinner boards activity--kids can spin their fidget spinner to figure out probability
*fidget spinner line plot activity
Great for end of the year activity!
Please leave me a feedback to let me know what you think! Thank you!!
Check out my other probability activity worksheets and my probability bundle to save money!
Coin, Dice, Colored Tiles P
Subjects:
Grades:
3rd - 8th
Types:
Also included in: Probability Activity BUNDLE
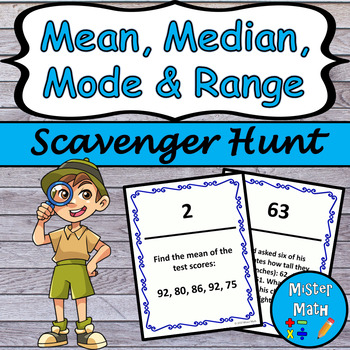
Mean, Median, Mode & Range Scavenger Hunt
Looking for a way to get your students out of their seats and engaged in the content? This scavenger hunt is just what you've been looking for to help students calculate mean, median, mode and range! Perfect for extra practice or a review before an assessment! The questions included are meant to be posted around the room. Students will then start at a question, working either independently, with a partner, or with a group. Once the question has been answered, students will search the room for th
Subjects:
Grades:
3rd - 6th
Types:
Also included in: Mean, Median, Mode & Range MEGA BUNDLE
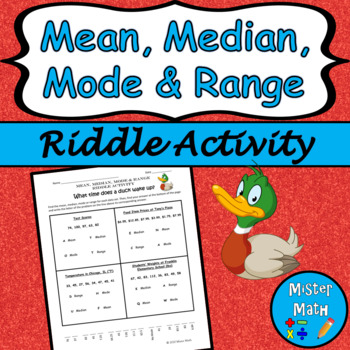
Mean, Median, Mode & Range Riddle Activity
Looking for a fun way for students to practice calculating mean, median, mode and range? This riddle activity is an engaging way for students to strengthen their skills in finding mean, median, mode and range while having fun! Guaranteed they will get a kick out of the terrible punchline at the end! This riddle activity contains 16 questions where students will be asked to calculate the measures of center of various real-life data sets. An answer key is included.☆ Perfect for centers, partner wo
Subjects:
Grades:
3rd - 6th
Types:
Also included in: Mean, Median, Mode & Range MEGA BUNDLE
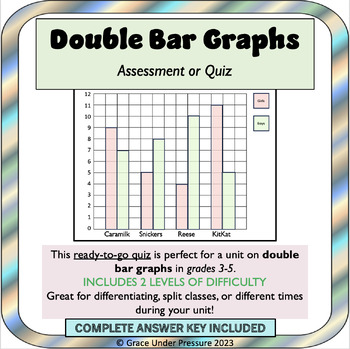
Bar Graphs: Double Bar Graph Math Quiz (Grades 3-5) Differentiated
This ready-to-go math quiz is perfect for a graphing unit on double bar graphs in grades 3-5. The first page uses a double bar graph with one-to-one correspondence. The second page uses a double bar graph with many-to-one correspondence (one square represents four people). Students have to determine that half a square represents two people since a whole square represents 4 people.Great for differentiating, split classes, or different times during your unit!Grades to Use With:This math assessment
Subjects:
Grades:
3rd - 5th
Types:
CCSS:
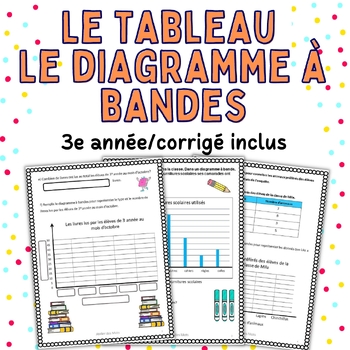
Le tableau. Le diagramme à bandes/Math worksheets
Le tableau. Le diagramme à bandes Voici une ressource pour consolider ou réviser Le tableau et Le diagramme à bandes.Cette ressource peut être utilisée en ateliers et centres de mathématique, comme travail supplémentaire ou devoir. Il convient aussi pour l’apprentissage à domicile. Je vous encourage à vérifier les aperçus pour juger si le document convient à votre classe. Aucune préparation n'est requise de votre part. Le corrigé est inclus. Toutes les ressources de mathématique ici. Si vous aim
Subjects:
Grades:
3rd
Types:
Also included in: Ensemble 3e année-Grammaire, Mathématique et Résolution/3rd grade Bundle
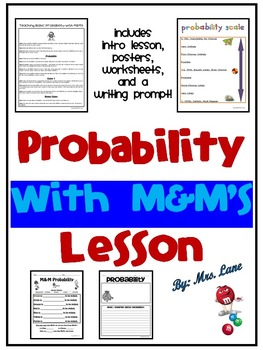
Probability with M&M's Lesson
Are you looking for a fun activity that introduces probability? Look no further! Save your valuable time because you found it!
------------------------------------------------------------------------------------------------
*THIS PRODUCT INCLUDES:
-Instructions
-Posters/Handouts (2): Probability Scale and How can data be used?
-Worksheets (4)
-Writing Prompt (1)
-Answer Keys
------------------------------------------------------------------------------------------------
*12 Pages Total.
Subjects:
Grades:
2nd - 4th
Types:
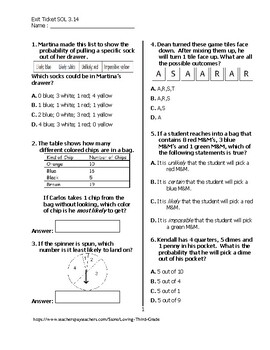
Exit Ticket #1 Math VA SOL 3.14 with TPT Digital Learning Option
This document contains approximately 10 questions related to the Virginia Standards of Learning 3.14 (investigate and describe the concept of probability as chance and list possible results of a given situation). This Exit Ticket is great to use before, during and/or after teaching the standard."TpT Digital Activities gives teachers an easy way to...add interactive elements like text boxes, annotations, and shapes to PDF resources to complete assignments entirely from a device – no need to p
Subjects:
Grades:
2nd - 4th
Types:
Also included in: Exit Ticket Math VA SOLs BUNDLE with TPT Digital Learning Option
Exit Ticket #2 Math VA SOL 3.14 with TPT Digital Learning Option
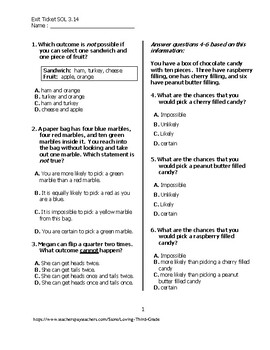
This document contains approximately 10 questions related to the Virginia Standards of Learning 3.14 (investigate and describe the concept of probability as chance and list possible results of a given situation). This Exit Ticket is great to use before, during and/or after teaching the standard."TpT Digital Activities gives teachers an easy way to...add interactive elements like text boxes, annotations, and shapes to PDF resources to complete assignments entirely from a device – no need to p
Subjects:
Grades:
2nd - 4th
Types:
Also included in: Exit Ticket Math VA SOLs BUNDLE with TPT Digital Learning Option
Elementary Probability Lesson
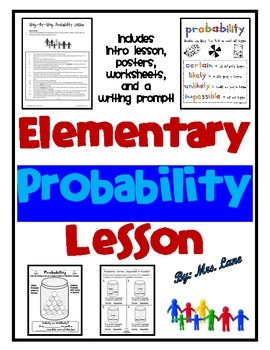
Are you looking for a basic step-by-step lesson (in the form of a teacher script) that introduces probability? Look no further! Save your valuable time because you found it!
------------------------------------------------------------------------------------------------
*THIS PRODUCT INCLUDES:
-Intro Lesson
-Posters (2)
-Worksheets (3)
-Writing Prompt (1)
-Answer Key
------------------------------------------------------------------------------------------------
*12 Pages Total
*NOTE:
Subjects:
Grades:
2nd - 4th
Types:
Probability Writing Prompt Worksheets
Research shows that students retain information better if they are able to explain it in writing. Use these probability writing prompts to help incorporate this strategy into your classroom for better learning outcomes of your students! Not only is this a great way to incorporate proven learning strategies for your students, but a great way to intertwine curriculum across subjects! They are great for math centers, math journals/notebooks, tutoring, review/closing a lesson, fast finishers, etc.
Subjects:
Grades:
2nd - 4th
Types:
Solving By Graphical Representation
Graphical representation can be introduced to grade 1 students as a visual way to represent and compare numbers. For example, a simple bar graph can be used to show the number of students in a class who have different eye colors. The height of each bar represents the number of students with that particular eye color.Similarly, a number line can be used to show the relationship between numbers, such as greater than or less than. Students can also practice counting and identifying patterns on a co
Subjects:
Grades:
1st - 3rd
Types:
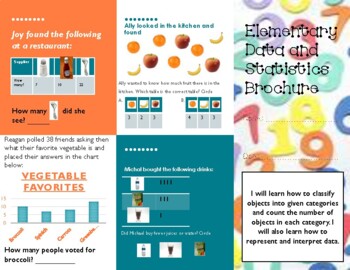
Lower Elementary Data and Statistics Brochure Activity (Data and Stat Standards)
This is a fun and interactive brochure activity RECOMMENDED For 1-3 grade. Use this activity in whole group, small group, independent math centers, homework, or as an assessment! This activity allows students to show their work in a unique and fun manner. This brochure follows data and statistic learning standards in grades 1-3. Students will learn how to classify objects into given categories and count the number of objects in each category. They will also learn how to represent and interpret d
Subjects:
Grades:
1st - 3rd
Types:
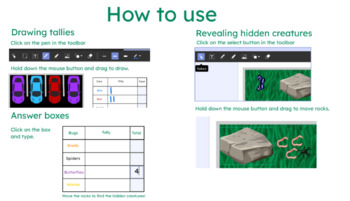
Tally Charts - DIGITAL ONLY - Easel Interactive
DIGITAL ONLY5 different tally chart activities to assign on Google Classroom using TPT's easel. Interactive, colourful and fun!
Subjects:
Grades:
K - 3rd
Types:
Kwanzaa pictogram activity
Kwanzaa differentiated pictogram activity, using previous tally chart knowledge.Answer sheet included. Looks good in B&W.
Subjects:
Grades:
2nd - 5th
Types:
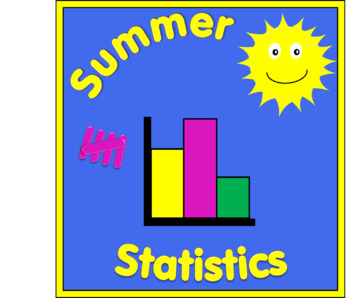
Summer Statistics - tally & bar charts.
Summer themed tally and bar chart activities. - 2 worksheet tasks with answers (8 pages). - 1 worksheet activity giving students an opportunity to carry out a survey in class and collecting/presenting results in a tally table and bar chart (2 pages).Digital Activity Available:The tally chart worksheets included in this resource would be fine to use as a digital activity. Instructions and answer boxes have been added to these pages. However, the bar charts would currently still be better to use i
Subjects:
Grades:
3rd - 5th
Types:
Showing 1-24 of 24 results


