
23 results
Preschool statistics microsofts


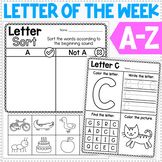

Mean, Median, Mode, Range; Modified Special Ed Math Template; Statistics
This is a modified worksheet from the middle school statistics curriculum. It is excellent for special education students who require an alternate or modified curriculum.
This worksheet allows teachers to input numbers in the blank space. This way teachers can use the template over and over with different numbers. Students are then to write the numbers in the correct order. Then, they have to find the mean, median, range, and mode. There are "hints" (formulas) that help the students differentia
Grades:
PreK - 12th
Types:

TPT KeyWord Strength Index (2010-2011) - Downloadable Spreadsheet!
What are the strongest keywords on TpT?
1. free downloads
2. Deanna Jump
3. math
Neither #1 nor #2 are surprises, but #3 (math) was certainly a surprise to me!
This report analyzes TpT's 2010-2011 keywords using a measure called "keyword strength".
The measure is based on a keyword's average rank, as well as the number of times it appeared in the 2010-2011 "Top 100" TpT search engine rankings.
This can be a valuable tool to help sellers understand TpT's marketplace supply and demand!
The P
Subjects:
Grades:
PreK - 12th, Higher Education, Adult Education, Staff

TPT KeyWord Strength Index (2010-2011) - Downloadable PDF!
What are the strongest keywords on TpT?
1. free downloads
2. Deanna Jump
3. math
Neither #1 nor #2 are surprises, but #3 (math) was certainly a surprise to me!
This report analyzes TpT's 2010-2011 keywords using a measure called "keyword strength".
The measure is based on a keyword's average rank, as well as the number of times it appeared in the 2010-2011 "Top 100" TpT search engine rankings.
This can be a valuable tool to help sellers understand TpT's marketplace supply and demand!
The P
Subjects:
Grades:
PreK - 12th, Higher Education, Adult Education, Staff

Reading a Line Plot; Modified Curriculum for Special Ed, Statistics
This line plot is modified from the middle school statistics curriculum. It is excellent for special education students who require an alternate or modified curriculum. The line plot is related to life science, and shows how many bones are in five different parts of the body. The questions on the worksheet ask questions about more and less. The answers are offered in a field of two.
This worksheet aligns with Maryland content standard:
Given a line plot using grade level content, student will c
Subjects:
Grades:
PreK - 5th
Types:

Surveys: Classroom All-IN-ONE Research Program
Empower Your Teaching with Data: Enhance Your Classroom with Powerful Survey Analysis!Elevate your teaching practice by leveraging the power of data with this user-friendly survey analysis program.Here's what sets it apart:Effortless Data Visualization: Transform survey responses into clear and visually appealing charts and graphs.Actionable Insights: Gain valuable insights into student learning styles, preferences, and areas for improvement.Informed Decisions: Make data-driven decisions to enha
Subjects:
Grades:
PreK - 12th, Higher Education, Adult Education, Staff
Types:

Calculate Student's Final Marks ( Grades ) in excel
If you want to easily calculate student's marks this excel document is great solution. I added all excel's necesarily formulas to make this important task so easier.When you add the marks for every subject, it's final mark will be automatically calculated. At the same time average grade will also be calculated and updated.There is also section for absences (excused and unexcused) which will also be calculated.At the end, if student's Overall grade is equal or above 4.5, it will be automaticaly w
Subjects:
Grades:
PreK - 12th, Higher Education, Adult Education, Staff
Types:

Venn Diagram lesson plan and resources
Lesson plan for teaching students how to use a Venn Diagram Pintables included for whole class and independent learning
Subjects:
Grades:
PreK - 6th
Types:
CCSS:

VicVELs Child Friendly Stats and Probability Footsteps Foundation to 6
Student friendly lists of VicVELs achievement standards for Statistics and Probability for Foundation to Level 6. These achievement standards are presented in a fun way for students and translated into child friendly language. Standards have also been broken into individual statements.
Subjects:
Grades:
PreK - 6th
Types:

Mathematics STATISTIC PROBABILITY Checklist Level 3 Victorian Curriculum 'I Can'
Level 3 Statistics and Probability Checklist aligned with the Victorian Curriculum. Fed up with recreating new checklists - ME TOO! Hope this helps. Here is a checklist completely aligned with the Victorian Curriculum. All put simply in 'I Can' statements as YOU WOULD TEACH IT!
MAKE LIFE SIMPLE! Teaching is time consuming enough.
Subjects:
Grades:
PreK - 6th
Types:

100th Day of School PowerPoint and Activities
A 100th Day of School celebration shows visual posters celebrating the 100th day of school. There are a hundred happy meals, a hundred balloons flying in the air, a hundred rocket ships blasting off, there are a hundred hearts giving love for Valentines Day, there are a hundred ornaments on a holiday tree, there are hundred petals on ten flowers. It's a great way to celebrate the 100th day of school.
Subjects:
Grades:
PreK - 3rd

Superhero Colored Birthday Posters!
Includes:
-12x superhero colored cupcake posters printable on a4 paper (1 for each month of the year)
-Editable candle template that you can type your students' names and date of birth onto.
- Blank candles that the students can color themselves
Great for a math data lesson!
Stick these absolutely adorable superhero colored birthday posters on your classroom wall to go with your superhero theme!
Subjects:
Grades:
PreK - 4th
Types:

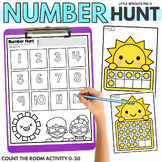
Easy Survey Tally Chart
Use this simple survey tally chart to help kids as young as 3 gather information. The chart is designed for yes or no questions.
Subjects:
Grades:
PreK - 1st
Types:

Guess Who?
An interactive PowerPoint designed for use with my Prep (Kindergarten) class. Featuring popular cartoon characters, this will encourage and motivate students as they play a twist on the popular game 'Guess Who'.
With the mathematical objective of data collection through yes/no questions, this will be used to generate questioning skills. Instead of one person being 'it' and guessing through questions, the whole class is 'it' with one person answering 'yes' or 'no' to the questions generated by
Subjects:
Grades:
PreK - 1st

VicVELS Statistics and Probability Achievement Standards Class Checklist
VicVELs Achievement Standards for Statistics and Probability presented in a class checklist for primary levels, foundation to level 6. Great assessment tracker tool.
Subjects:
Grades:
PreK - 6th
Types:

Math Vocabulary Word Wall Statistics - Spanish PK - 2nd Grade
My Math Vocabulary Word Wall is divided into five parts, per objective. This is the statistics section. There are four words per page. Each vocabulary word is bolded at the top center, and includes a definition and illustration on most words. This post included 3 pages, 12 words in Spanish, and is intended for grades PK - 2nd.
Subjects:
Grades:
PreK - 2nd

Math Vocabulary Word Wall Statistics PK - 2nd Grade
My Math Vocabulary Word Wall is divided into five parts, per objective. This is the statistics section. There are four words per page. Each vocabulary word is bolded at the top center, and includes an illustration on most words. This post included 3 pages, 12 words, and is intended for grades PK - 2nd.
Subjects:
Grades:
PreK - 2nd

Survey Recording- Learning to tally
We used this as part of the MCAS-Alt, but can be used to teach how to record survey data. I have uploaded this as a powerpoint so that you are able to fully edit it as you need, including names. Each page has 4 categories that students can use to take survey data.
Subjects:
Grades:
PreK - 2nd
Types:

Maths - Data representation - favourite food pictograph activity cut and paste
Australian (Victorian Curriculum Year 1 and 2 levels), Maths - statistics and probability - Gathering data in a pictograph, modelling with class p.1, and task p. 2-4.Page 1 can be used as a teacher model and class data collection and pages 2-4 is the task for students that may use this for cut and paste activity to represent data using pictures for a pictograph. Foods are relatable to students of all countries.
Subjects:
Grades:
PreK - 4th
Types:

Penny Toss Recording Sheet
Recording sheet for the penny toss game. Goes along with the Toss the Chips game from the Investigations math series.
Subjects:
Grades:
PreK - 2nd
Types:


Tokyo Olympics Medal Tally PowerPoint Australia and general
Olympics medal tally.Australia and general.PowerPoint.
Subjects:
Grades:
PreK - 6th
Types:

Probability Books
Integrate Math and Language Arts lessons with this annotated bibliography of great children's books to introduce probability and statistics to students.
Subjects:
Grades:
PreK - 2nd
Types:
Sochi Olympic Medal Tally
A tally chart to keep track of Olympic achievement. Can be editted to fit classroom needs.
Subjects:
Grades:
PreK - 12th
Showing 1-23 of 23 results

TPT is the largest marketplace for PreK-12 resources, powered by a community of educators.
IXL family of brands