Gridiron Glory -- "Big Game" Data & Paper Football - 21st Century Math Project
- Zip
- Google Apps™

Also included in
- This is a selection of my Probability & Expected Value resources all in a money saving Essential Bundle! You save significant money and time versus purchasing these separately!Essential Bundles are designed to give you everything you need to rock your unit. Warmups, Notes, Activities, Games, ExiPrice $35.00Original Price $87.00Save $52.00
- The project is the core of what I have built my classroom around. Scaffolding learners to real world projects. This bundle includes the 105+ math projects I have written. This is over 2,700 pages of content.21st Century Math Projects each scaffold through an authentic context and math skill buildingPrice $395.00Original Price $564.00Save $169.00
- This is a selection of my Data Displays & Analysis resources all in a money saving Essential Bundle! You save significant money and time versus purchasing these separately!Essential Bundles are designed to give you everything you need to rock your unit. Warmups, Notes, Activities, Games, Exit TiPrice $35.00Original Price $146.50Save $111.50
- 12 of my best selling projects/units all in an organized money saving bundle! These engaging, student/teacher approved math projects that provide rigor, relevance, and cross-curricular content altogether. Want more projects?•21st Century Math Projects -- All the Projects•More Algebra 2 / Pre-CalculuPrice $45.00Original Price $69.00Save $24.00
Description
I have heard that Americans like Football. I have also heard about an important game that happens in February. I have heard that it's a day that nachos dread.
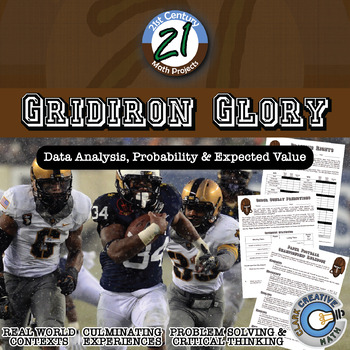
In this 21st Century Math Project, students will complete a variety Football-based assignments related to the Statistics strands of the Common Core. The project caps off with a Paper Football tournament that asks students to use expected value to guide their decisions!
This product includes 3 prep assignments that reaches a variety of learning levels. Some will work better in middle school, others strictly high school. Download the preview to judge for yourself. ***THIS PRODUCT HAS BEEN UPDATED WITH A GOOGLE SLIDES INTERACTIVE VERSION INCLUDED. REDOWNLOAD IF YOU HAVE IT ALREADY***
Included in this file are:
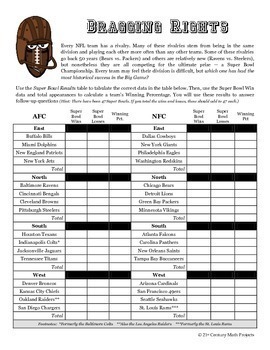
-- “Bragging Rights”. This assignment is designed more toward middle school students, but can be used for high school review. Students will analyze Super Bowl data to determine which divisions have historically had the most success. They will compute Winning Percentage and construct a bar graph and a pie graph.
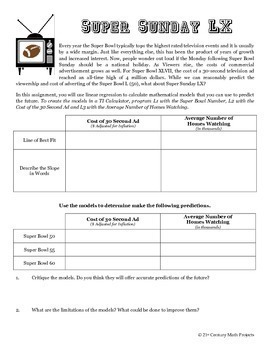
-- “Super Sunday LX”. This assignment is geared more toward students with algebra skills. Students will use historical television data to create lines of best to predict the future. This assignment would work best on TI graphing calculators. This also shows the limits of linear models because the Commercial Cost linear model has serious limitation.
-- “Super Sunday Predictions”. This is an advanced statistics assignment that will require calculations of Mean, Standard Deviation, Variance and beginning level usage of a T-Test. Students will analyze Points For and Points Against of Super Bowl Winners and Losers to see if there is a significant difference between the means (this is what the T-Test is for). If there is a significant difference, then that could be used to predict the winner of the next Super Bowl. Find out!
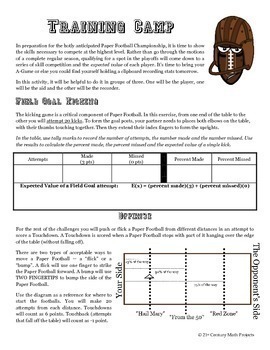
-- “Training Camp”. This is a preliminary assignment to the grand finale a Paper Football Championship Tournament! Students will measure their Paper Football skills with a variety of tasks. With the results of the assignment, students will need to calculate their expected value. At the end they will use these four expected values to calculate their “Paper Football Rating”.
-- "Paper Football Championship Tournament". Each game should have two students playing the roles of referee and statisticians. These students should receive the “Drive Log” and mark attempts for further statistical analysis and keep score. The essential question with the Paper Football Championship is "does the Expected Value “Paper Football Ratings” predict who the winner of the tournament will be?"
In this 21 page document you will be given a mapping to the Content Standards, an outline for how to implement the project, 4 prep assignments and the final project. Download the preview to see it all.
You may be interested in the following discounted bundles. SAVE $$$!
•Correlations & Advanced Stats
•21st Century Math Projects -- All the Projects
Need an Entire Curriculum?
•21st Century Algebra 2 / Pre-Calculus –- the Entire Curriculum
For more tips, tricks and ideas check out the Clark Creative Education Blog
And join our community where I post ideas, anecdotes, elaborations & every once in a while I pass out TPT gift cards! And jokes! I do jokes too!

