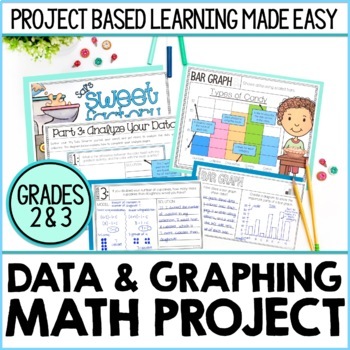
2nd & 3rd Grade Data and Graphing Math Project | Bar Graphs, Line Plots & More
- Zip
- Google Apps™

What educators are saying
Description
This graphing math project introduces your students to four methods for displaying data:
★ Frequency Tables ★ Bar Graphs ★ Pictographs ★ Line Plots ★
Your students will have the opportunity to record observations about each method for displaying data and compare/contrast methods for collecting data.
They will then use this knowledge to solve a problem for Sal’s Sweet Factory.
***************************************************************************
THE BIG PROBLEM YOUR STUDENTS WILL SOLVE:
Sal's Sweet Factory is having some trouble with their production line...the number of sweets being added to each box is unequal. Students will work through the following steps to help the factory solve its problem:
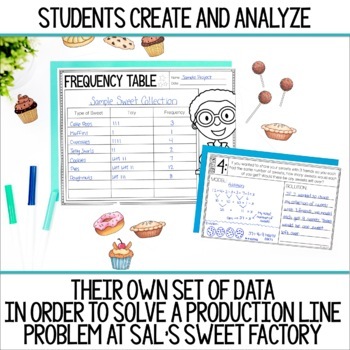
★Record the number of each sweet from their sample on a frequency table.
★Display their data in multiple ways using a pictograph, bar graph & line plot.
★Analyze their data by answering questions that require them to refer to the various tables and graphs they’ve created. Each question is increasingly more challenging to build students’ data analysis skills.
★Propose a solution for Sal’s Sweet Factory.
Complete a self-assessment using a four-point rubric.
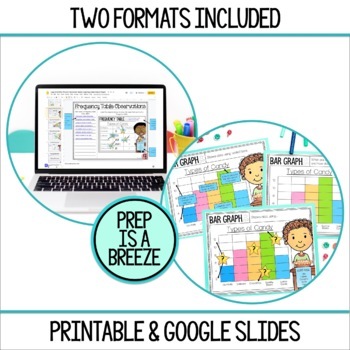
A print and Google Slides digital version of this resource are both included with your purchase.
***************************************************************************
WHAT’S INCLUDED (DIGITAL VERSION):
★ Teacher Guide - A 5-page guide to save you time and make prep quick and easy. This guide includes:
- Suggestions for scheduling and implementing this simulation.
- Detailed steps for adding this project as an assignment to Google Classroom.
- Ideas for wrapping up the simulation to boost reflection and closure.
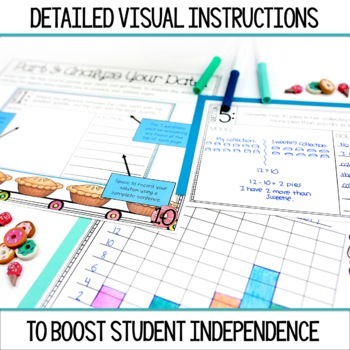
★ Google Slides Digital Student Guide - An 29-page guide with detailed instructions and visuals to help your students complete each step of this simulation successfully. The format of this guide makes differentiation easy. Use it as a supplement to your verbal instructions as you provide scaffolding, or let your more advanced students work through each step of the project independently.
★ Digital Lesson Slides - 4 detailed slides featuring different methods for collecting and displaying data. You will use these slides to teach your students about frequency tables, pictographs, bar graphs, and line plots while they take notes on each data collection method.
★ Digital Example Project - Completed examples of the entire digital project. This can be used as a reference for you the first time you work through this simulation with your students, or as a tool for scaffolding and differentiating for your students.
***************************************************************************
WHAT’S INCLUDED (PRINT VERSION):
★ Teacher Guide - A 9-page guide to save you time and make prep quick and easy. This guide includes:
- Suggestions for scheduling and implementing this simulation.
- Quick prep checklists with tips from using this project in my own classroom.
- Ideas for wrapping up the simulation to boost reflection and closure.
★ Student Guide - An 11-page guide with detailed instructions and visuals to help your students complete each step of this simulation successfully. The format of this guide makes differentiation easy. Use it as a supplement to your verbal instructions as you provide scaffolding, or let your more advanced students work through each step of the project independently.
★ Data & Graphing Mini Posters - Twelve mini posters that guide students in learning about frequency tables, bar graphs, pictographs, and line plots. Three mini posters for each method of data collection are included to provide scaffolding for students as they learn about graphs and charts.
★ Data Templates - Your students will gather their own data during this simulation, and display it on a frequency table, bar graph, pictograph, and line plot. One blank template for each method for displaying data is included.
★ My Data Smarts Journal - This 18-page journal includes a summarized version of the instructions provided in the detailed Student Guide, along with pages where students record their observations about each chart/graph during the first session of the simulation. There are also pages where students answer rigorous multi-step word problems related to the data they’ve collected during the simulation.
★ Rubric - Using this 4-point rubric, students can self-assess during the course of the simulation. This rubric can also be used by you to provide a final score at the end of the simulation, making this a perfect alternative assessment for your data analysis & graphing unit.
***************************************************************************
PEDAGOGY:
This math simulation introduces students to four methods for collecting and displaying data, then has them apply that knowledge to solve a problem for Sal’s Sweet Factory. Throughout the process of the simulation, students will have the opportunity to demonstrate their understanding through graph design, multi-step problem solving, and data analysis.
Every step of this project based learning experience is outlined in a guide that includes clear visuals and step-by-step instructions. Rubrics and reflection prompts will encourage your students to reach their learning goals.
The format of this project gives students the opportunity to exercise the standards for mathematical practice, share their creativity, and display understanding in unique and engaging ways.
This is an ideal resource for:
★ At your seat & hands on enrichment during math workshop or guided math
★ Math center work
★ Digital learning (a Google Slides version of the entire project is included)
★ Parent volunteer or teacher’s aide enrichment station
★ A focal point for a data & graphing room transformation
***************************************************************************
BOOSTING RIGOR:
Not only does this simulation teach students about data and graphing, it allows them to immediately apply their understanding through a purposeful data analysis activity.
Engagement will soar as your students see how practical graphing and data analysis are in solving real world problems, rather than being bogged down with worksheets or busy work.
This simulation also serves as a wonderful alternative assessment that allows you to measure student understanding on a deeper level, and can be used as a complete data & graphing unit or as a culminating activity for your existing unit.
***************************************************************************
BUILDING STUDENT INDEPENDENCE:
This math project guide is designed with student independence in mind. Detailed instructions and checklists are provided for students so they can participate with maximum independence. You can guide them as needed, and pull small groups that help address the more individualized needs of your students. This allows students to work at their own pace and take ownership of their learning.
On the day of the simulation launch, you will take 15-20 minutes to set the scene and teach students how to navigate their materials. After that, your students will be off on an independent math adventure that lasts multiple sessions.
***************************************************************************
SAVING TIME:
Want to incorporate a project or simulation into your data and graphing math unit, but crunched for instructional time?
This resource makes prepping for a simulation a breeze, and makes implementation seamless. The detailed visual instructions on each page of the guide make it possible for students to complete their unique project with maximum independence so you have the time you need to teach or reteach essential data and graphing skills to small groups.
Scoring and providing students with feedback is also a breeze when using the included rubric. Each of the three project phases: observation, graphing and data analysis has its own section on the rubric so students can participate in the assessment process as they demonstrate learning, and you can provide them with specific feedback about their work.
***************************************************************************
OTHER MATH PROJECTS BY CORE INSPIRATION:
★ Place Value In The Wild - Place Value PBL Unit
★ The Time of Your Life - Telling Time Simulation
★ Val’s Heart Factory - Data & Graphing Simulation
★ Winter Wonderland Array Architects - Arrays & Multiplication PBL Unit
★ Measure-Thon - Measurement PBL Unit
★ Quadrilateral City - Geometry PBL Unit
***************************************************************************
LET'S CONNECT: ★ The Core Inspiration Blog ★ Instagram ★ Pinterest ★ Facebook ★


