
Earth Day Math Project for Graphing and Data Interpretation


What educators are saying
Also included in
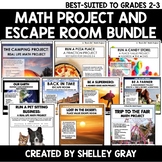 Ready to infuse real-life experience into your Math class? Math projects are a great way to do just that!This is a bundle of TEN Math Projects and Escape Rooms: Run a Candy Store (place value to 100)The Camping Trip (addition and subtraction to 100)Run a Pizza Place (fractions)Back In Time (to the OPrice $39.75Original Price $48.25Save $8.50
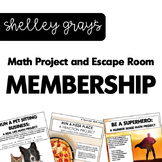 Would you like to have access to ALL of the Math Projects and Escape Rooms that I create?I will be continuing to add projects to this growing bundle as I post them. All curriculum will continue to be 2nd-5th grade focused. Owning this membership access ensures that you have the material to challengePrice $179.00Original Price $244.45Save $65.45
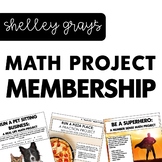 Would you like to have access to ALL of the Math Projects that I create?This membership currently includes 37 math projects, spanning from 2nd grade to 5th grade curriculum (some can be used for 6th). As I create more projects, they will be added to this bundle.Purchasing this membership bundle ensuPrice $105.00Original Price $178.00Save $73.00
Description
This resource is included in PDF format for printing and in Google Slides™️ format for digital learning. This makes it useable with Google Classroom™️.
Are you looking for a way to reinforce graphing and data interpretation concepts in an engaging way that helps your students make connections? “Our Earth” is a real-life math project where students will complete eleven different graphing and data-related tasks.
These activities can be used as a package, or in isolation. They work great as a math center, small-group lesson, early finisher activity, or partner activity. This particular project is great for the month surrounding Earth Day.
Take a look at what you’ll find inside this math project:
TASK #1: SORTING RECYCLABLES
You’ve decided to do more to help the environment! You start by sorting the materials in your recycling bin at home. Use the data to create a tally chart. Then interpret it and transfer the data to a line plot.
Skills: tally charts, line plots, transferring data
TASK#2: COLLECTING GROCERY BAGS
Did you know that you can crochet plastic grocery bags together to create a re-usable shopping bag? Your class has decided to collect as many plastic bags as you can for this project. Use the bar graph to answer the questions.
Skills: bar graphs
TASK #3: TREE PLANTING
The park in town has committed to plant new trees this year, but they need help getting all of them planted. You and your friends decide to help! Use the picture graph to answer the questions. Then transfer the data to the bar graph.
Skills: picture graphs, bar graphs
TASK#4: ENERGY CONSUMPTION
You’ve decided to keep track of how many hours per day the lights are on in your house. Read and interpret the data from the line graph. Then create a line graph for Week 2 and compare the two.
Skills: line graphs, comparing data
TASK#5: COMPOST
Another project that you’ve decided to do at home is create a compost. You’ll collect food scraps and add it to the compost each day. Then it will turn into soil that you can use in your garden!
Skills: tally charts
TASK #6: GROWING OUR OWN FOOD
You decide to plant a garden this summer. You’ll plant carrots, peas, potatoes, peppers, and tomatoes. Use the circle graph to figure out the amount of time that you spend preparing and planting your garden. Then use the picture graph to figure out the number of seeds you planted.
Skills: circle graphs, estimation, picture graphs
TASK #7: SAVING RAIN WATER
To water your garden throughout the summer, you’ll be collecting rain water in barrels so that you don’t have to use tap water. Add the data to the bar graph.
Skills: bar graphs
TASK #8: BIKING VS. DRIVING
You know that when you walk or bike instead of drive, it is better for the environment. You decide to survey the other kids at your school to see how many of them bike or walk to school instead of driving.
Skills: tally charts
TASK #9: LUNCHBOX CHALLENGE
The transportation challenge was so much fun that your class decides to do a lunch box challenge! You’re hoping that this challenge will encourage people to use more re-usable containers in their lunches.
Skills: bar graphs, tally charts, transferring data
TASK #10: DITCH CLEAN UP
Garbage tends to collect in the ditches around your community, so you’ve decided to do something about it! Interpret and complete the graphs to see how many bags of trash each team collected. Record all of the data in a table.
Skills: circle graphs, bar graphs, tally charts, tables
TASK #11: REUSABLE MATERIALS
Your school has an after-school Art Club. The club is asking for re-usable materials for an upcoming project! Interpret the line plot to see how many materials were collected in February and March.
Skills: line plots, comparing data
PLUS TWO BONUS WRITING ACTIVITIES
to use at the beginning and end of the project
*
*
WAYS TO USE MATH PROJECTS IN YOUR CLASSROOM:
Math projects are an ideal way to consolidate learning. I recommend using them as an engaging activity AFTER skills have been learned rather than during learning. You will likely find that engagement is very high and that your students ask to do more of these!
There are many ways to use math projects in your classroom. Some of the most popular are:
•a small-group or pairs activity
•a guided math activity to allow you to see where your students are struggling
•a fun, rewarding way to engage your early finishers
•a low-prep, easy-to-implement activity for a substitute teacher
•
Enjoy!
Shelley Gray
