5 results
2nd grade statistics outlines
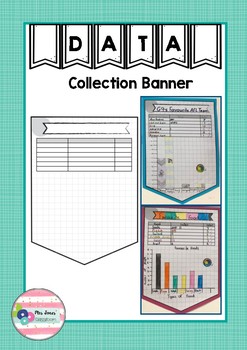
Data Collection Banner
Are your students collecting their own data and representing it using a graph this term? Then why not get them presented on this banner pendant and display them in your room.
Subjects:
Grades:
1st - 10th
Types:
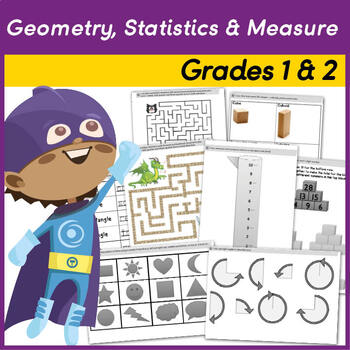
Geometry, Statistics and Measure Activities and Templates for Grades 1 and 2
A great 61 page set of no prep templates, activities and images to help your class develop their understanding of geometry, statistics and measure. Can be used independently or as a support when working with a variety of models and images. Perfect for introducing and using new concepts as well as rehearsing previous sessions
Subjects:
Grades:
K - 2nd
Types:
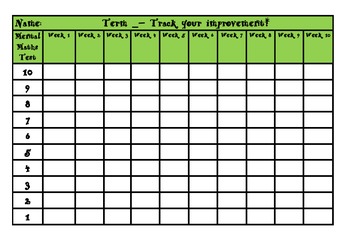
Track your improvement - mental maths graph!
Here is a printable that you can give to your students, which will help them to graph their weekly mental maths test results! Each set contains the most commonly sized mental maths tests - a graph for 10, 15, 20 and 30 questions. I have found that students achieve the best results when they can see themselves improving, and have to physically colour in a graph each week. They love trying to beat their score! This is great to put into their portfolio or take home folder so that parents (and stude
Subjects:
Grades:
2nd - 7th
Types:
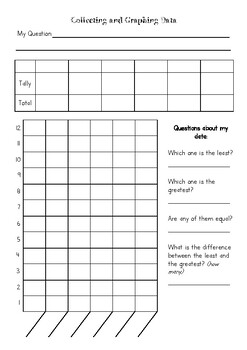
Collecting and graphing data
Surveying, collecting, graphing & interrupting a data set ALL IN ONE.Use this as part of your Maths session to assist students with various skills.
Subjects:
Grades:
2nd - 6th
Types:
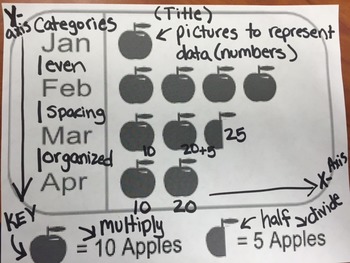
Pictographs Anchor Chart
Pictographs Anchor Chart
TEKS 2.10 B- The student will organize a collection of data with up to 4 categories using pictographs and bar graphs with intervals of one or more
TEK 2.10 C-The student will write and solve one step word problems involving addition or subtraction using data represented within pictographs and bar graphs with intervals of one
Subjects:
Grades:
1st - 4th
Types:
Showing 1-5 of 5 results


