3 results
2nd grade statistics lectures

Data Representation Powerpoint
The presentation contains: 1) TALLY MARKS Learning Objectives. Definition of a tally mark. Uses of tally mark. How to count a tally mark. Tally Mark Chart. Construction of a tally mark table with an example. Application on real life problems on tally mark. Read and Interpret a tally mark table.The presentation contains: 2) FREQUENCY DISTRIBUTION TABLEDefinition of a Frequency Distribution Table. Types of Frequency Distribution Table: a) Discrete Frequency Distribution Table (Ungrouped).b) C
Subjects:
Grades:
1st - 10th, Higher Education, Staff

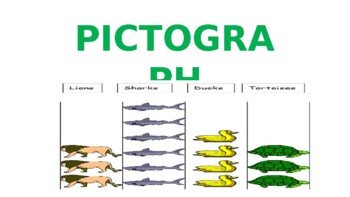
Pictograph Powerpoint
The presentation contains:Learning Objectives.Definition of a Pictograph.Parts of a pictograph.Tips for construction of pictograph.Steps to construct pictograph with an example.Scaling and drawing a pictograph.Read and Interpret a pictograph.
Subjects:
Grades:
1st - 7th, Staff
Also included in: Data Representation Powerpoint

Probability and Statistics in Elementary
This is a presentation that describes how the foundation of probability and statistics looks vertically from elementary to support higher learning in future grades for students. This a great resource for elementary math professional development or college students completing Education course work.
Grades:
PreK - 5th
Showing 1-3 of 3 results


