96 results
High school statistics center microsofts

Candy Probability: Discovery of EXPERIMENTAL vs. THEORETICAL Probability
Middle Schoolers LOVE probability!
This is a GREAT lesson around Halloween when the kids are already hyped up on sugar and want to 'talk' to their classmates.
This activity allows the students to DISCOVER the differences between EXPERIMENTAL and THEORETICAL probability and connect it to everyday experiences. The probability lesson lends itself to fractions, decimals, percents, data collection, rational & irrational numbers, statistical graphs (box and whiskers, frequency tables...), measu
Subjects:
Grades:
5th - 9th
Types:
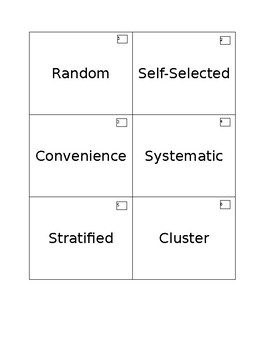
Sampling Methods Matching Activity
18 cards included. Students match six types of sampling methods (random, cluster, stratified, convenience, systematic, and self-selected) with their definitions and an example of each type. Teacher answer key included for easy assessment. When students are finished, they should have 6 groups of 3 cards each for teacher/other group to check.
Subjects:
Grades:
9th - 12th
Types:
CCSS:
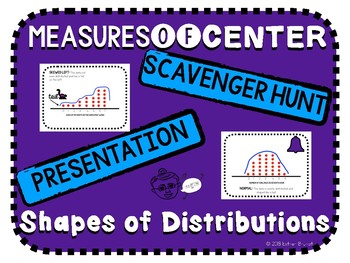
Shapes of Distributions and Measures of Center Scavenger Hunt and Presentation
A note to the teacherThis resource is for teaching shapes of distributions, analyzing the use of the mean versus the median, and deciphering which among the two is higher based on the shape of the distribution.This resource includes:Keynote and Powerpoint Presentation & PDF(Animated)Shapes of DistributionsNormalSkewed LeftSkewed Rigt2 Examples EachWhich Measure of Center is More Appropriate (Mean vs Median)6 Example Knowledge Check Which Measure of Center is Higher (Mean vs Median)?6 Example
Subjects:
Grades:
8th - 12th
Also included in: Math Activity Bundle
Probability project using Real-World March Madness Tournament
Jump into the March Madness tournament to apply probability concepts to a real-world application. Great for your sports-loving students. Students explore probability first by determining the probability that a team will win. Students, further, weight teams based on historical data and/or team statistics. This mini-project allows for creative problem-solving and has some open-ended answers.Included in this resource:★ Student pages for 3 March Madness related activities★ Detailed guidelines fo
Subjects:
Grades:
7th - 10th
Types:
Also included in: 7th Grade Math Resource Bundle
Would You Rather Two Way Tables
Would you rather be rich and fat or poor and skinny? Would you rather have a light saber or helper monkey? Do boys and girls respond differently to such questions? Students will survey classmates and then analyze the results using two way tables. Addresses Common Core Math Standard 8.SP.A.4.
Subjects:
Grades:
8th - 10th
Types:
CCSS:
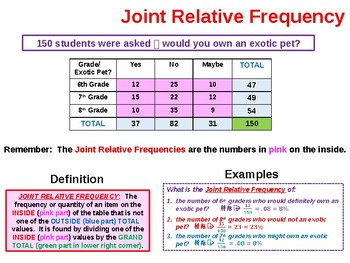
Two Way Frequency Tables Summary
This MS PowerPoint presentation provides background information on 2-Way Frequency Tables as well as the specific steps to follow create and analyze them. It is used to kickoff our study of this subject n my Pre-Algebra and Math I classes. It addresses all of the terms encountered in the construction and use of 2-Way tables including Joint Relative Frequency, Marginal Relative Frequency and Conditional Relative Frequency. It is a totally animated ppt file and very easy for students to underst
Subjects:
Grades:
8th - 10th
Permutations and Factorial Notation Worksheet (17 Questions)
Permutations and Factorial Notation Worksheet17 Questions with the solutions1 page for the questions1 page for the answers* AlSO AVAILABLE FOR YOU OR A COLLEAGUE! - CLICK ANY LINK YOU WANT:Probability & OddsMean, median, mode, range, line plot, and Box and whisker WorksheetStatistical Math (GED REVIEW)The Binomial Theorem Worksheet (10Q)Theoretical Probability WorksheetProbability Word Problems (Worksheet) You may also be interested in my other top-selling products: EQUIVALENT FRACTIONS (33
Subjects:
Grades:
9th - 12th, Higher Education, Adult Education, Staff
Types:
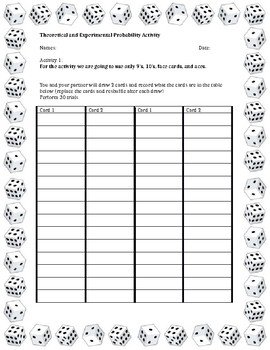
Theoretical and Experimental Probability Activity
These activities have students interact with playing cards and dice to practice with theoretical and experiment probability. Questions on the worksheet vary in difficulty.
Subjects:
Grades:
7th - 10th
Types:
CCSS:
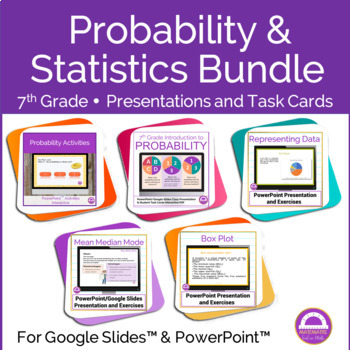
Bundle Statistics and Probability | 50% Discount
PowerPoint presentations on statistics and probalility. Perfect for an online lesson or distance learning.You can send it to your students and they'll have everything they need. If you are online with them, you can project it and comment.Or you can simply print it and give to your students.Suitable for IB MYP Middle Years ProgrammeIt includes:Mean, Mode and Median.With examples and exercises, for students to practice.This product and:Distance Learning - Mean. Mode, Median - Google Slideshttps:/
Subjects:
Grades:
6th - 9th
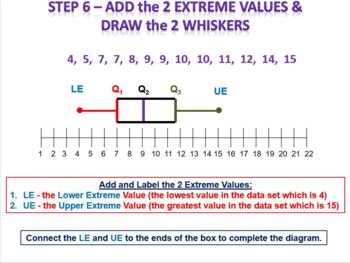
Math 1 / Algebra 1 Bundle - Unit 9 Statistical Measures and Data Analysis
This bundle includes various instructional MS PowerPoint (PPT) slidepacks that I initially use when covering the Math 1/Algebra 1 content area titled: Unit 9 - Statistical Measures and Data Analysis. The following slidepacks are included in this bundle:Box and Whisker Plot Analysis and Construction including Outliers General Statistics - Mean, Median, Mode, Range and Mean Absolute Deviation Mean, Median, Mode, Range and Standard Deviation SummaryScatterplots and Correlation SummaryTwo Way Frequ
Subjects:
Grades:
9th - 12th
Mean, Median, Mode, Range and Standard Deviation Summary
I use this MS PowerPoint presentation file to kickoff our study of Statistics in my 9th grade Math I or Algebra I classes. It reviews the definitions and detailed methods required to calculate the mean, median, mode, range and standard deviation of a data set(s). It is a totally animated ppt file and very easy for students to understand. Any of the ppt animations can be modified as desired by the presenter (teacher). It also includes 2 example problems for the students to complete at the en
Subjects:
Grades:
8th - 9th
CCSS:
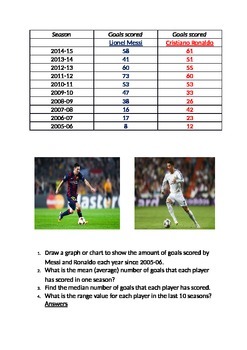
Messi v Ronaldo - mean, mode, median, range.
Data handling with a soccer twist. Find the mean, median, mode and range of the goals scored by the extraordinary Lionel Messi and Cristiano Ronaldo over the last 10 years, and create a variety of graphs and charts in the process.
Subjects:
Grades:
5th - 12th
Types:
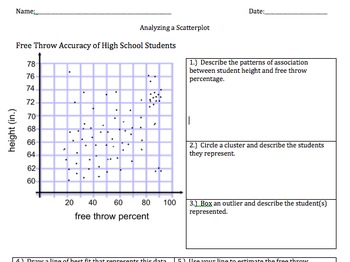
8.SP.1 and 8.SP.2 Analyze a Scatterplot
This activity hits the main intent of both 8.SP.1 and 8.SP.2. Engage students with a scatterplot relevant to their lives that explores the association between student height and free throw accuracy. They describe whether the association is linear or non-linear, positive or negative, strong or weak. Students will also identify clusters and outliers and predict what they represent. (For example, the outlier who is really tall but a really bad shot may be a center, like Shaquille O'Neal whose e
Subjects:
Grades:
7th - 9th
Types:
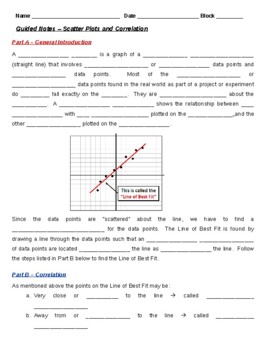
Guided Notes - Scatter Plots and Correlation (Student & Teacher Versions)
This MS Word file is a Guided Notes document that reviews both the concept and steps involved in solving and developing Scatter Plots for linear equations or functions. It also includes a review of Correlation and how to calculated it using a graphing calculator. I use these notes with my Math 1, Math 2 and Algebra 1 students immediately after I introduce this concept with my PPT presentation slidepack on the same subject. It is 3 full pages of notes for the students to complete and includes t
Subjects:
Grades:
8th - 11th
CCSS:
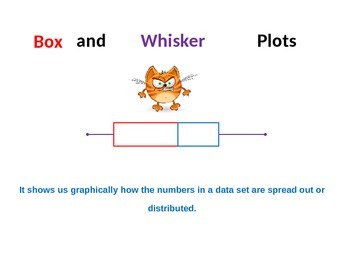
Box and Whisker Plot Analysis and Construction including Outliers
I use this MS PowerPoint presentation file to kickoff our study of Box Plots in my Pre-Algebra and Math I classes. It reviews in detail how to analyze a data set and to construct a Box Plot to accurately depict the distribution of the data (numbers). It is a totally animated ppt file and very easy for students to understand. Any of the ppt animations can be modified as desired by the presenter (teacher). It also includes 2 example problems for the students to complete at the end of the slid
Subjects:
Grades:
7th - 9th
CCSS:
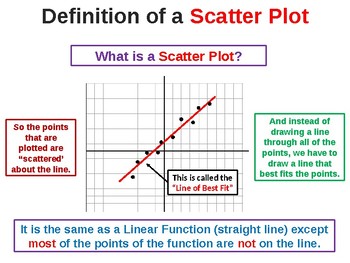
Scatterplots and Correlation Summary
This MS PowerPoint presentation covers the specifics of both Scatterplots and Correlation. It is used to kickoff our study of these topics in my Pre-Algebra and Math I classes. It covers the detailed steps to follow to analyze a data set and construct a Scatterplot and Line of Best Fit as well as determine the Correlation of the data. It covers the steps to use with to determine these measures without a graphing calculator. It is a totally animated ppt file and very easy for students to unde
Subjects:
Grades:
8th - 10th
CCSS:
Chi Square Lab for AP Biology
I use this activity to introduce chi square to my students in AP Biology.It scaffolds their learning so that we walk through the definitions and basic concepts, then dive right into practice problems. We used AP biology examples, M&M color distributions, and practice genetics problems to understand how to calculate and use the chi square value.The students are always super engaged throughout the lesson and generate their own data for may of the components of the lab.By the end of the lesson,
Subjects:
Grades:
10th - 12th
Types:
Common Core Rich Math Task in Data Management NO PREP
Looking for a rich math task that aligns with the common core standards? This math project is used for the data management outcome. Use this project to teach the entire unit. This project has exemplars to use as guides for students. Have students brainstorm their own survey and census questions!
--------------------------------------------------------------------
What's included?
- Step by step instructions on how to conduct a survey or census
-A copy of a 5 page census survey, created by my o
Subjects:
Grades:
5th - 12th
Types:
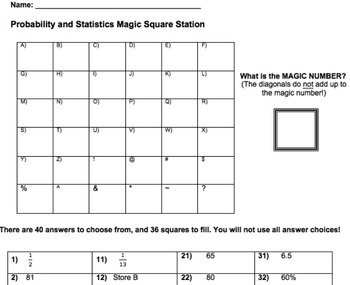
Probability and Statistics Magic Square Activity
This magic square activity is a fun and engaging way to review probability and statistics skills! The students work to solve each problem while also determining what the "magic number" is. The student worksheet and activity are included. My 7th graders loved working on this for an end of the year review assignment!
Subjects:
Grades:
6th - 9th
Types:
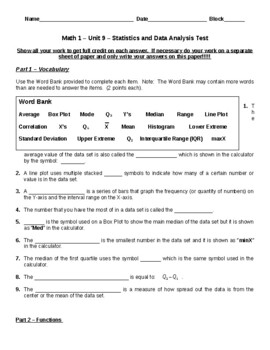
Math 1/Algebra 1 Assessment/Practice Test - Unit 9 Statistics and Data Analysis
This MS Word file is a Math 1/Algebra 1 Assessment / Practice Test for:Unit 9 - Statistics and Data Analysis It consists of seventeen (17) questions and one (1) extra credit item. I used to use this document as my assessment for Unit 9 of my 8th Grade, Math 1 and Algebra 1 classes. Since I now use an online program for all of my math assessments, I now use this document as a practice test the day before I give the online assessment. It is fourteen (12) pages in length, including the Teacher A
Subjects:
Grades:
7th - 10th
Types:
Also included in: Math 1/Algebra 1 Assessment/Practice Tests - Units 1-10 Bundle
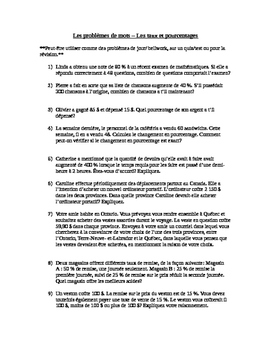
FRENCH math- Les pourcentages, rapports et taux - rates, percentages and ratios
17 FRENCH word problems that can be used for Bellwork, problem of the day or on a quiz or test. Made to go along with the percentages, ratios and rates unit in Ontario.
**Peut-être utiliser comme des problèmes de jour/ bellwork, sur un quiz/test ou pour la révision.**
Subjects:
Grades:
7th - 10th
Types:
Guided Notes - Box Plots (Student & Teacher Versions)
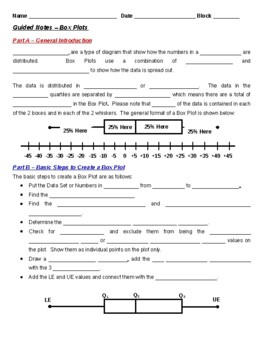
This MS Word file is a Guided Notes document that reviews both the concept and steps involved in solving and producing Box Plots. I use these notes with my Math 1, Math 2 and Algebra 1 students immediately after I introduce this concept with my PPT presentation slidepack on the same subject. It is 2 full pages of notes for the students to complete and includes the detailed steps that I teach my students to use to solve and produce Box Plots. The 3rd page includes an example problem that is wo
Subjects:
Grades:
8th - 10th
CCSS:
The Two Day Basketball Math Project, GOOGLE DOC VERSION
The Two Day Basketball Math Project is exactly like it sounds. It was designed for an advanced middle school or early high school student (preferably a basketball fan) to complete in about two days and contains quite a bit of rigor for something that the student will think is a fun change of pace. It's not a project that requires any pre-planning or supplies. It's just a great project that is a bit all-encompassing as far as math skills are concerned. They will learn how some basketball stat
Subjects:
Grades:
6th - 12th
Applied Statistics End of Year Review Stations
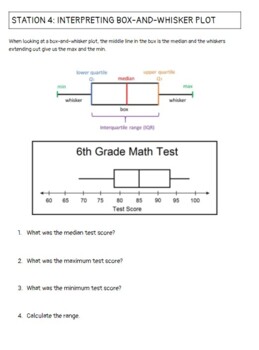
A set of 10 stations to help students practice interpreting bar graphs, stem-and-leaf plots, and box-and-whisker plots. Also, works with finding the mean, median, mode, and range. Finally, have probability and normal distribution questions.
Subjects:
Grades:
7th - 12th
Types:
CCSS:
Showing 1-24 of 96 results


