
73 results
Statistics resources by TpT sellers for TpT sellers


Normal Bell Curve (Normal Distribution) Clipart
Normal Bell Curve (Normal Distribution) Clipart: This Normal Bell Curve (Normal Distribution) clipart set includes 17 distinct styles (6 blank styles and 11 styles with scores) that come in both PNG (transparent) and JPEG (white background) for a total of 34 images. All image files are 300dpi. Commercial use is allowed with proper credit given (see my Terms of Use in the download – or read prior here). Below is a breakdown of all the images included in this product.Normal Bell Curve (NBC) Table
Subjects:
Grades:
Not Grade Specific

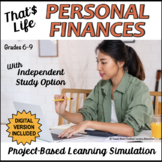
Teacherpreneur Data Insights - TPT Seller Business Tracker Analysis Spreadsheets
Welcome to Teacherpreneur Data Insights – a business data tracker designed to elevate your teacher seller journey. Gain actionable insights, track trends, and optimize your strategies with this comprehensive tool. In a world where data is powerful, this guidebook and Google Sheets combo empowers you to navigate your TPT store effectively. Seamlessly analyze your metrics, make informed decisions, and propel your store to new heights. Utilize this powerful tool to identify your best-selling produc
Subjects:
Grades:
Not Grade Specific

Statistics Clipart - SCATTERPLOT GRAPHS
Need some clipart for your secondary grades statistics product? This graphics resource features 7 different scatterplot graphs in a variety of different options that are perfect for making worksheets, interactive notebook elements, interactive whiteboard activities and more! The graphs all come in the following options:2) labeled or unlabeled 3) color, grayscale, or blacklineThe following distribution types are represented by at least one of the graphs:- positive correlation- negative correlat
Subjects:
Grades:
Not Grade Specific
Also included in: Statistics Clipart - Graphs, Secondary Grades - BUNDLE

FLIPBOOK ESTADÍSTICA Y PROBABILIDAD
FLIPBOOK para trabajar los siguientes contenidos: ¿Qué es la estadística?Variables estadísticas.Frecuencias,Media y modaMediana y rango¿Qué es la probabilidad?Sucesos: seguro, posible e imposible. Tipos de gráficos.
Subjects:
Grades:
5th - 8th

Activity for Theoretical and Experimental Probability of Compound Events
This Skittles Lab is a fun and engaging way to get students excited about finding probabilities. The experiment involves finding the theoretical and experimental probability of choosing a specific order of skittles from a bag. Students work best in groups of three to calculate their probabilities and reflect on their results. This extends what students learned about Single Event Probabilities and now involves a Compound Event. There are step-by-step instructions for students to follow through ou
Subjects:
Grades:
7th
CCSS:

Statistics Clipart - Graphs, Secondary Grades - BUNDLE
Need some graph clipart for your secondary grades statistics product? This clipart bundle includes 5 different clipart sets. You save 30% by buying them together.The graphs in each product come in a variety of options that make them perfect for making worksheets, assessments, interactive notebook activities, and interactive white board files!Options:1) labeled or unlabeled2) color/grayscale/blackline)These graphs, like ALL my clipart, can be used as moveable pieces in digital resources. No ad
Subjects:
Grades:
Not Grade Specific

Statistics Clipart - CIRCLE GRAPHS
Need some clipart for your secondary grades statistics product? This graphics resource features 8 different circle graphs (aka: pie charts) in a variety of different options that are perfect for making worksheets, interactive notebook elements, interactive whiteboard activities and more! The graphs all have an unlabeled color key, and come in the following options:2) labeled (with numerical percentages) or unlabeled 3) color, grayscale, or blacklineThese graphs, like ALL my clipart, can be use
Subjects:
Grades:
Not Grade Specific
Also included in: Statistics Clipart - Graphs, Secondary Grades - BUNDLE

Statistics Clipart - DOT PLOTS, SET 2
Need some MORE clipart for your secondary grades statistics product? This graphics resource features 8 different dot plot graphs in a variety of different options that are perfect for making worksheets, interactive notebook elements, interactive whiteboard activities and more! This second set is designed to be a bit easier than the 1st set. The graphs all come in the following options:2) labeled or unlabeled 3) color, grayscale, or blacklineThe following distribution types are represented by
Subjects:
Grades:
Not Grade Specific
Also included in: Statistics Clipart - Graphs, Secondary Grades - BUNDLE

Normal Distribution Statistics Clipart
A collection of 90 images of normal curves (bell curves), labeled subdivided by standard deviation. Includes shaded distributions by standard deviation sections. Also includes examples of other skewed distributions, symmetric distributions, binomial distributions, t-distribution, chi-square. Includes cumulative distribution and probability plots for normal, negatively skewed and positively skewed distributions. Ideal for creating resources for normal distribution and empirical rule concepts
Subjects:
Grades:
Not Grade Specific

Statistics Clipart - HISTOGRAM GRAPHS
Need some clipart for your secondary grades statistics product? This graphics resource features 8 different histogram graphs in a variety of different options that are perfect for making worksheets, interactive notebook elements, interactive whiteboard activities and more! The graphs all come in the following options:1) labeled or unlabeled2) transparent background or whitefilled 3) color, grayscale, or blacklineThe following distribution types are represented by at least one of the graphs:- p
Subjects:
Grades:
Not Grade Specific
Also included in: Statistics Clipart - Graphs, Secondary Grades - BUNDLE

IM Grade 6 MathTM Guided Math Notes and Teacher Version
Here are all the notes needed for 6th grade math. This product included the student and teach version of the notes. This resource is based on the IM K-12 MathTM authored by Illustrative Mathematics® and offered under a CC BY 4.0 License.
Subjects:
Grades:
6th

Statistics Clipart - DOT PLOTS, SET 1
Need some clipart for your secondary grades statistics product? This graphics resource features 8 different dot plot graphs in a variety of different options that are perfect for making worksheets, interactive notebook elements, interactive whiteboard activities and more! The graphs all come in the following options:2) labeled or unlabeled 3) color, grayscale, or blacklineThe following distribution types are represented by at least one of the graphs:- positive distribution- negative distributi
Subjects:
Grades:
Not Grade Specific
Also included in: Statistics Clipart - Graphs, Secondary Grades - BUNDLE

Which Quarterback is the G.O.A.T.? - Using Statistical Calculations
Note: This is an upgraded version of the Statistical Analysis Using Football (QB) Stats. If you have previously purchased this resource please email me and I will send you the updated version.This project has students calculate percents, averages, and ratios, as well as create scatterplots, box and whisker plots, and histogram (bar graphs) based on their calculations.Google slideshow includes 12 well know Hall of Fame quarterbacks including Joe Namath, Roger Staubach, Terry Bradshaw, Joe Montana
Subjects:
Grades:
6th - 9th
CCSS:

Statistics Clipart - BOX PLOTS
Need some clipart for your secondary grades statistics product? This graphics resource features 8 different box plot graphs (aka: box and whisker plots) in a variety of different options that are perfect for making worksheets, interactive notebook elements, interactive whiteboard activities and more! The graphs all come in the following options:1) vertical or horizontal2) labeled or unlabeled3) color, grayscale, or blacklineThese graphs, like ALL my clipart, can be used as moveable pieces in d
Subjects:
Grades:
Not Grade Specific
Also included in: Statistics Clipart - Graphs, Secondary Grades - BUNDLE

Mean, Median, Mode, and Range Project
This includes the instructions to give to the students as well as the rubric for grading the project. They must gather their own data and then complete the calculations using the data they collected.
Subjects:
Grades:
5th - 7th

Statistics Clipart - PROBABILITY SPINNERS
FREE! There are 2 graphics for each of the following probability terms:
~ Certainly/ Impossible
~ Very Likely/ Very Unlikely
~ Equal Chance
______________________________________________________________________________________
This clipart collection includes a commercial use license that allows you to use these graphics to develop original digital download products to sell on TpT, Boom Learning, and similar online forums. For products that are intended to be printed, the graphics must be "l
Subjects:
Grades:
Not Grade Specific

4th grade Data Analysis: Frequency Charts, Dot Plots, and Stem-and-Leaf Plots
This activity uses real NBA data to engage students in analyzing data. Students use data from 10 games of 12 players to create frequency charts, dot plots, and stem-and-leaf plots. Questions included allow students to reflect and analyze their work. Sure to grab your students' attention!
Subjects:
Grades:
4th

Find the Error - Data and Graphs with Central Tendency and Variation
This is an activity that I created for my students to find the mistake when a student has answered questions from graphs about measures of center and variation incorrectly. I used common errors to help them see the mistakes commonly made. All of my products are common core aligned.I had the students work alone to solve the problems first, and then share with their groups. If there was any discrepancy, they looked in the answer folder on their tables to see the correct answer. I rotated around
Subjects:
Grades:
5th - 7th

TPT KeyWord Strength Index (2010-2011) - Downloadable Spreadsheet!
What are the strongest keywords on TpT?
1. free downloads
2. Deanna Jump
3. math
Neither #1 nor #2 are surprises, but #3 (math) was certainly a surprise to me!
This report analyzes TpT's 2010-2011 keywords using a measure called "keyword strength".
The measure is based on a keyword's average rank, as well as the number of times it appeared in the 2010-2011 "Top 100" TpT search engine rankings.
This can be a valuable tool to help sellers understand TpT's marketplace supply and demand!
The P
Subjects:
Grades:
PreK - 12th, Higher Education, Adult Education, Staff

(1,2,4,5,9 and 10) Squares per Inch Graph Paper/ Different Colors Format A4.
This Packet Includes 12 Pages Of Colorful Graphing Paper Multi Squares.This Graph Paper Is Great To Use:- For Math Problems! Simply Place One Number in Each Box and Line Them up So Numbers Are Easily Read and There’s A Spot for Each Number in Your Answer.- For Analysis! If You Are In Need Of Doing Analysis Of Any Stuff Or Want To Find Out The Structural Data Then In Such Conditions You Need The Graph.- For Presentation! If You Are In Need Of Presenting Any Presentation Related To Statistical Dat
Subjects:
Grades:
Not Grade Specific

Game Night Backgrounds and Clipart
Do you have a probability or statistics unit coming up ? Or a game day or night planned? Use these 5 x 7 casino themed backgrounds for Boom Cards, invitations, Google headers, labels, task cards, etc. This file comes with 29 backgrounds and borders in red and black and 10 dice and card clipart pngs with a transparent background.
Subjects:
Grades:
Not Grade Specific
Also included in: Digital Paper Backgrounds and Clipart Bundle - Commercial Use

TPT KeyWord Strength Index (2010-2011) - Downloadable PDF!
What are the strongest keywords on TpT?
1. free downloads
2. Deanna Jump
3. math
Neither #1 nor #2 are surprises, but #3 (math) was certainly a surprise to me!
This report analyzes TpT's 2010-2011 keywords using a measure called "keyword strength".
The measure is based on a keyword's average rank, as well as the number of times it appeared in the 2010-2011 "Top 100" TpT search engine rankings.
This can be a valuable tool to help sellers understand TpT's marketplace supply and demand!
The P
Subjects:
Grades:
PreK - 12th, Higher Education, Adult Education, Staff
36:46
Be Your Own TpT Data Whiz - TpT Conference Video
Have you struggled to try to understand your TpT Data? Sometimes looking at the product stats and the dashboard can be a bit daunting. This video is from the TpT Forward 21 conference and it is full of great information to help you understand everything you need to know about conversion rates, optimization rates, and so much more!This video will:keep you from falling asleep (no boring data talk here!)explain data in an easy-to-understand way!explain conversion ratesexplain optimization rates (vi
Subjects:
Grades:
Not Grade Specific

Lunch with Teacher- Classroom Economy
Lunch with a teacher is always a fun reward for students! I do one lunch per quarter, and each student can bring a friend. Included in my lunch is pizza, snack, drink, and desert.
Subjects:
Grades:
Not Grade Specific
Also included in: Classroom Economy-Coupons/Vouchers
Showing 1-24 of 73 results

TPT is the largest marketplace for PreK-12 resources, powered by a community of educators.
IXL family of brands