152 results
Statistics activboard activities by TpT sellers for TpT sellers
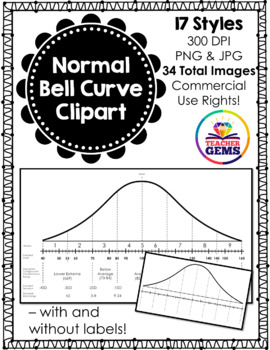
Normal Bell Curve (Normal Distribution) Clipart
Normal Bell Curve (Normal Distribution) Clipart: This Normal Bell Curve (Normal Distribution) clipart set includes 17 distinct styles (6 blank styles and 11 styles with scores) that come in both PNG (transparent) and JPEG (white background) for a total of 34 images. All image files are 300dpi. Commercial use is allowed with proper credit given (see my Terms of Use in the download – or read prior here). Below is a breakdown of all the images included in this product.Normal Bell Curve (NBC) Table
Subjects:
Grades:
Not Grade Specific
Teacherpreneur Data Insights - TPT Seller Business Tracker Analysis Spreadsheets
Welcome to Teacherpreneur Data Insights – a business data tracker designed to elevate your teacher seller journey. Gain actionable insights, track trends, and optimize your strategies with this comprehensive tool. In a world where data is powerful, this guidebook and Google Sheets combo empowers you to navigate your TPT store effectively. Seamlessly analyze your metrics, make informed decisions, and propel your store to new heights. Utilize this powerful tool to identify your best-selling produc
Subjects:
Grades:
Not Grade Specific
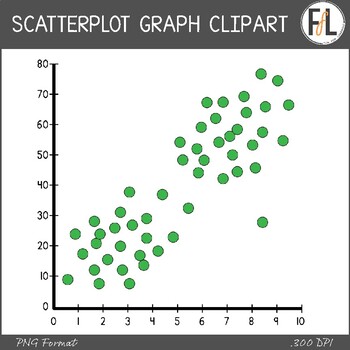
Statistics Clipart - SCATTERPLOT GRAPHS
Need some clipart for your secondary grades statistics product? This graphics resource features 7 different scatterplot graphs in a variety of different options that are perfect for making worksheets, interactive notebook elements, interactive whiteboard activities and more! The graphs all come in the following options:2) labeled or unlabeled 3) color, grayscale, or blacklineThe following distribution types are represented by at least one of the graphs:- positive correlation- negative correlat
Subjects:
Grades:
Not Grade Specific
Also included in: Statistics Clipart - Graphs, Secondary Grades - BUNDLE
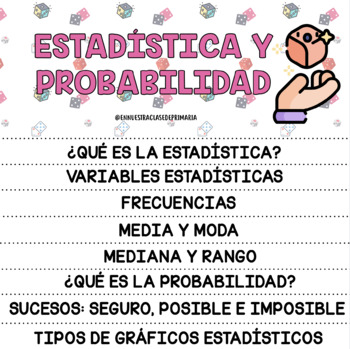
FLIPBOOK ESTADÍSTICA Y PROBABILIDAD
FLIPBOOK para trabajar los siguientes contenidos: ¿Qué es la estadística?Variables estadísticas.Frecuencias,Media y modaMediana y rango¿Qué es la probabilidad?Sucesos: seguro, posible e imposible. Tipos de gráficos.
Subjects:
Grades:
5th - 8th
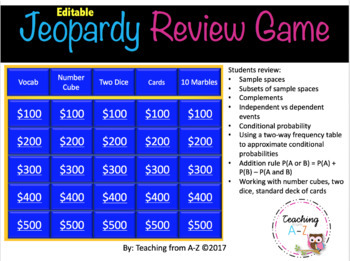
Probability Review Game
Use this Jeopardy-like review game to improve your students' understanding of key concepts in probability. This is a fun way to have students review:*Sample spaces*Subsets of sample spaces*Complements*Independent vs dependent events*Conditional probability*Using a two-way frequency table to approximate conditional probabilities*Addition rule P(A or B) = P(A) + P(B) – P(A and B)*Working with number cubes, two dice, standard deck of cardsThis is a PowerPoint Presentation. You can EDIT the problems
Subjects:
Grades:
9th - 12th
Also included in: Algebra Review Game Growing Bundle
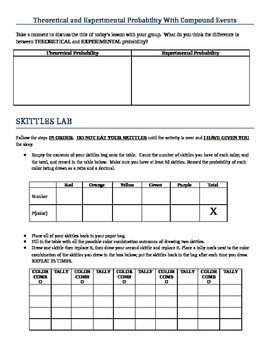
Activity for Theoretical and Experimental Probability of Compound Events
This Skittles Lab is a fun and engaging way to get students excited about finding probabilities. The experiment involves finding the theoretical and experimental probability of choosing a specific order of skittles from a bag. Students work best in groups of three to calculate their probabilities and reflect on their results. This extends what students learned about Single Event Probabilities and now involves a Compound Event. There are step-by-step instructions for students to follow through ou
Subjects:
Grades:
7th
CCSS:
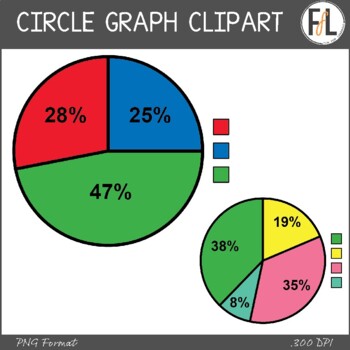
Statistics Clipart - CIRCLE GRAPHS
Need some clipart for your secondary grades statistics product? This graphics resource features 8 different circle graphs (aka: pie charts) in a variety of different options that are perfect for making worksheets, interactive notebook elements, interactive whiteboard activities and more! The graphs all have an unlabeled color key, and come in the following options:2) labeled (with numerical percentages) or unlabeled 3) color, grayscale, or blacklineThese graphs, like ALL my clipart, can be use
Subjects:
Grades:
Not Grade Specific
Also included in: Statistics Clipart - Graphs, Secondary Grades - BUNDLE
Statistics Clipart - Graphs, Secondary Grades - BUNDLE
Need some graph clipart for your secondary grades statistics product? This clipart bundle includes 5 different clipart sets. You save 30% by buying them together.The graphs in each product come in a variety of options that make them perfect for making worksheets, assessments, interactive notebook activities, and interactive white board files!Options:1) labeled or unlabeled2) color/grayscale/blackline)These graphs, like ALL my clipart, can be used as moveable pieces in digital resources. No ad
Subjects:
Grades:
Not Grade Specific
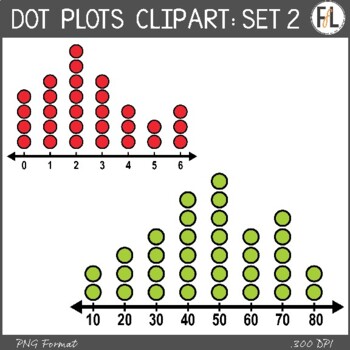
Statistics Clipart - DOT PLOTS, SET 2
Need some MORE clipart for your secondary grades statistics product? This graphics resource features 8 different dot plot graphs in a variety of different options that are perfect for making worksheets, interactive notebook elements, interactive whiteboard activities and more! This second set is designed to be a bit easier than the 1st set. The graphs all come in the following options:2) labeled or unlabeled 3) color, grayscale, or blacklineThe following distribution types are represented by
Subjects:
Grades:
Not Grade Specific
Also included in: Statistics Clipart - Graphs, Secondary Grades - BUNDLE
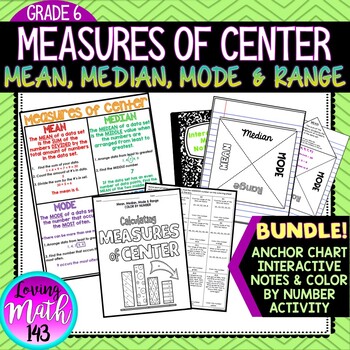
Mean Median Mode and Range Interactive Notes, Poster and Activity BUNDLE
Mean, Median, Mode & Range Color By Number ActivityThis color by number activity is a fun and engaging way for students to practice calculating the measures of center including mean, median, mode and range. Students will solve 16 questions involving mean, median mode, and range then find their answer on the color by number sheet. If their answer is not on the color by number then their answer is not correct. This activity is aligned with the sixth (6th) grade common core standards.WHATS INCL
Subjects:
Grades:
5th - 8th
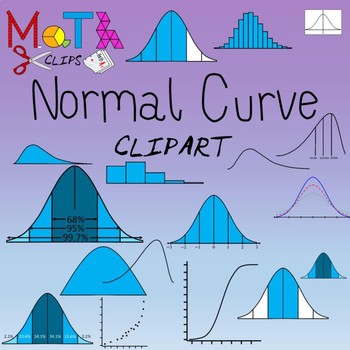
Normal Distribution Statistics Clipart
A collection of 90 images of normal curves (bell curves), labeled subdivided by standard deviation. Includes shaded distributions by standard deviation sections. Also includes examples of other skewed distributions, symmetric distributions, binomial distributions, t-distribution, chi-square. Includes cumulative distribution and probability plots for normal, negatively skewed and positively skewed distributions. Ideal for creating resources for normal distribution and empirical rule concepts
Subjects:
Grades:
Not Grade Specific
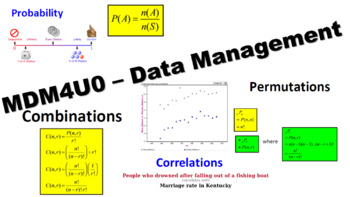
MDM4U - Grade 12 Math - Mathematics of Data Management - FULL COURSE!
This is my complete course package for the Grade 12 Data Management (MDM4U) course following the Ontario Secondary Mathematics Curriculum. This package includes:Smart Notebook and PowerPoint lessons with Student PDF versions for every lesson of every unit in the course. (I have also included versions with my notes for your use)A complete student workbook that covers every lesson in the course. Each lesson concludes with appropriate workbook sections, so you can use whatever textbook you want!App
Subjects:
Grades:
12th
CCSS:
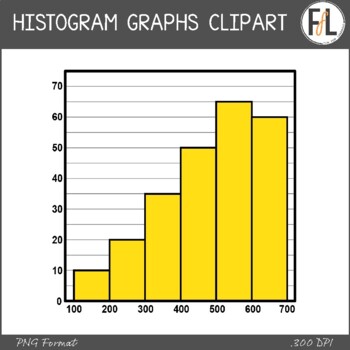
Statistics Clipart - HISTOGRAM GRAPHS
Need some clipart for your secondary grades statistics product? This graphics resource features 8 different histogram graphs in a variety of different options that are perfect for making worksheets, interactive notebook elements, interactive whiteboard activities and more! The graphs all come in the following options:1) labeled or unlabeled2) transparent background or whitefilled 3) color, grayscale, or blacklineThe following distribution types are represented by at least one of the graphs:- p
Subjects:
Grades:
Not Grade Specific
Also included in: Statistics Clipart - Graphs, Secondary Grades - BUNDLE
MDM4U - Statistical Analysis Unit - Full Teacher Package
This is my complete Statistical Analysis Unit package for the Grade 12 Data Management (MDM4U) course following the Ontario Secondary Mathematics Curriculum. This package includes:Smart Notebook, PowerPoint lessons with Student PDF versions for every lesson in the unit.A complete student workbook that covers every lesson in the unit. Each lesson concludes with appropriate workbook sections, so you can use whatever textbook you want!Appropriate unit tests/quizzes/assignments with answer keys.A fu
Subjects:
Grades:
12th
MDM4U - Organization of Data for Analysis Unit - Full Teacher Package
This is my complete Organization of Data for Analysis Unit package for the Grade 12 Data Management (MDM4U) course following the Ontario Secondary Mathematics Curriculum. This package includes:Smart Notebook and PowerPoint lessons with Student PDF versions for every lesson in the unit.A complete student workbook that covers every lesson in the unit. Each lesson concludes with appropriate workbook sections, so you can use whatever textbook you want!Appropriate unit tests/quizzes/assignments with
Subjects:
Grades:
12th
MDM4U - Probability Distributions Unit - Full Teacher Package
This is my complete Probability Distributions Unit package for the Grade 12 Data Management (MDM4U) course following the Ontario Secondary Mathematics Curriculum. This package includes:Smart Notebook and PowerPoint lessons with Student PDF versions for every lesson in the unit.A complete student workbook that covers every lesson in the unit. Each lesson concludes with appropriate workbook sections, so you can use whatever textbook you want!Appropriate unit tests/quizzes/assignments with answer k
Subjects:
Grades:
12th
MDM4U - Counting and Probability Unit - Full Teacher Package
This is my complete Counting and Probability Unit package for the Grade 12 Data Management (MDM4U) course following the Ontario Secondary Mathematics Curriculum. This package includes:Smart Notebook and PowerPoint lessons with Student PDF versions for every lesson in the unit.A complete student workbook that covers every lesson in the unit. Each lesson concludes with appropriate workbook sections, so you can use whatever textbook you want!Appropriate unit tests/quizzes/assignments with answer ke
Subjects:
Grades:
12th
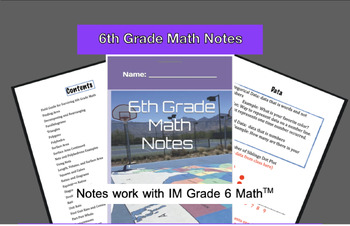
IM Grade 6 MathTM Guided Math Notes and Teacher Version
Here are all the notes needed for 6th grade math. This product included the student and teach version of the notes. This resource is based on the IM K-12 MathTM authored by Illustrative Mathematics® and offered under a CC BY 4.0 License.
Subjects:
Grades:
6th
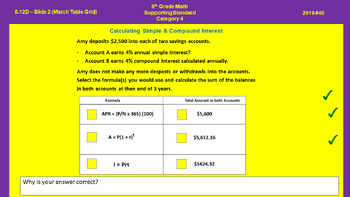
Math Jam Interactive Slides - 8th Gr Cate 4
Jamboard slides aligned to Math STAAR Release problems and new items types that include Equation Editor, Text Entry, Graphing, Number Line, Hot Spot, Fraction Model, Drag n Drop, Match Table Grid and Multiselect. Resource can be used to expose students to the new item types on the STAAR Redesign math assessment.
Subjects:
Grades:
8th
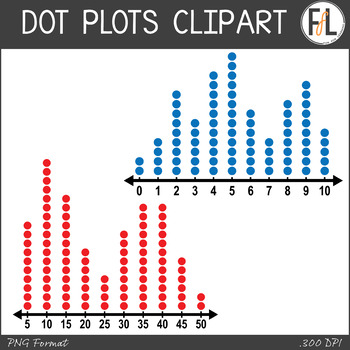
Statistics Clipart - DOT PLOTS, SET 1
Need some clipart for your secondary grades statistics product? This graphics resource features 8 different dot plot graphs in a variety of different options that are perfect for making worksheets, interactive notebook elements, interactive whiteboard activities and more! The graphs all come in the following options:2) labeled or unlabeled 3) color, grayscale, or blacklineThe following distribution types are represented by at least one of the graphs:- positive distribution- negative distributi
Subjects:
Grades:
Not Grade Specific
Also included in: Statistics Clipart - Graphs, Secondary Grades - BUNDLE
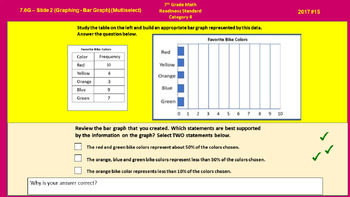
Math Jam Interactive Slides - 7th Grade Cate 4
Jamboard slides aligned to Math STAAR Release problems and new items types that include Equation Editor, Text Entry, Graphing, Number Line, Hot Spot, Fraction Model, Drag n Drop, Match Table Grid and Multiselect. Resource can be used to expose students to the new item types on the STAAR Redesign math assessment.
Subjects:
Grades:
7th
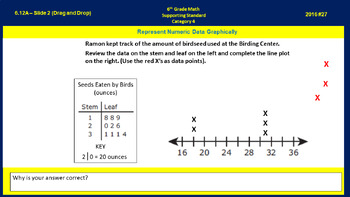
Math Jam Interactive Slides - 6th Gr Cate 4
Jamboard slides aligned to Math STAAR Release problems and new items types that include Equation Editor, Text Entry, Graphing, Number Line, Hot Spot, Fraction Model, Drag n Drop, Match Table Grid and Multiselect. Resource can be used to expose students to the new item types on the STAAR Redesign math assessment.
Subjects:
Grades:
6th
Types:
Categorical Data vs Numerical Data Flip Chart
In this flip chart, students will learn the difference between categorical data and numerical data, examples, and key vocabulary. The activinspire flip chart allows the teacher to reveal the information by removing the shapes over the correct information. At the end of the lesson are five questions which the students have to classify as categorical or numerical.
Grades:
5th - 8th
Types:

Statistics animated powerpoint lesson template
Content:1.Introduction2.Discrete Data3.Continuous Data4.Central Tendancy of a Data Set5.Range and Interquartile Range6.Box and Whisker Plot
Subjects:
Grades:
8th - 9th
Showing 1-24 of 152 results


