146 results
Statistics simulations by TpT sellers for TpT sellers
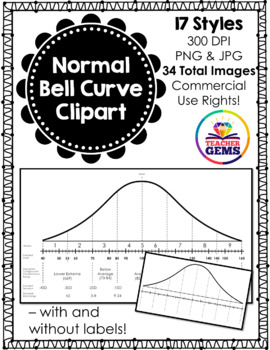
Normal Bell Curve (Normal Distribution) Clipart
Normal Bell Curve (Normal Distribution) Clipart: This Normal Bell Curve (Normal Distribution) clipart set includes 17 distinct styles (6 blank styles and 11 styles with scores) that come in both PNG (transparent) and JPEG (white background) for a total of 34 images. All image files are 300dpi. Commercial use is allowed with proper credit given (see my Terms of Use in the download – or read prior here). Below is a breakdown of all the images included in this product.Normal Bell Curve (NBC) Table
Subjects:
Grades:
Not Grade Specific
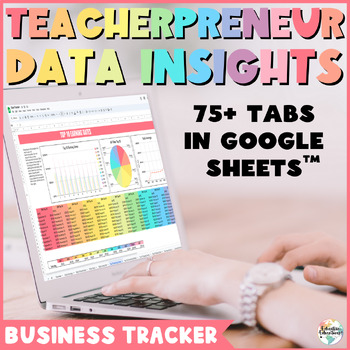
Teacherpreneur Data Insights - TPT Seller Business Tracker Analysis Spreadsheets
Welcome to Teacherpreneur Data Insights – a business data tracker designed to elevate your teacher seller journey. Gain actionable insights, track trends, and optimize your strategies with this comprehensive tool. In a world where data is powerful, this guidebook and Google Sheets combo empowers you to navigate your TPT store effectively. Seamlessly analyze your metrics, make informed decisions, and propel your store to new heights. Utilize this powerful tool to identify your best-selling produc
Subjects:
Grades:
Not Grade Specific
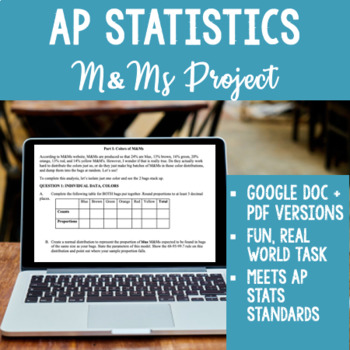
AP Statistics M&M Sampling Distribution Project - Works for Distance Learning!
NEW for 2020! This resource now includes both a PDF for printing out a physical copy AND a fully editable Google Doc link for remote or distance learning! Assign the Google doc to your students, and they can type their answers directly into the document and submit their work digitally. They can also create normal curve diagrams in Google Docs using Insert-Image (kids figure out how to do this quite quickly, as I learned this year!)I use this project every year in my AP Statistics class to demyst
Subjects:
Grades:
10th - 12th
Types:
Also included in: AP Statistics Project Bundle! 6 Projects + digital versions
Probability-Theoretical and Experimental-Crab Derby Race CCSS 7.SP.C.5, 6, and 7
This is a fun, engaging 3 part activity including lesson plan that will have your kids so engaged they will forget they are actually learning math. Students will first work in groups/partners and simulate a crab derby race in a game using the sum of two dice to see whose crab will cross the finish line first. Then, they will complete a matrix of possible outcomes when two dice are tossed and added together to get particular sums. They will answer questions that apply to both theoretical and e
Subjects:
Grades:
5th - 9th
Types:
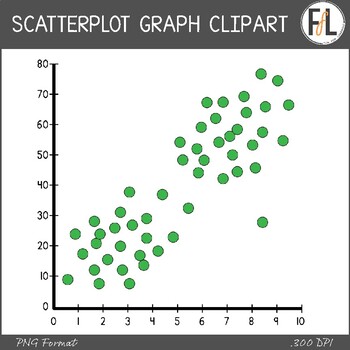
Statistics Clipart - SCATTERPLOT GRAPHS
Need some clipart for your secondary grades statistics product? This graphics resource features 7 different scatterplot graphs in a variety of different options that are perfect for making worksheets, interactive notebook elements, interactive whiteboard activities and more! The graphs all come in the following options:2) labeled or unlabeled 3) color, grayscale, or blacklineThe following distribution types are represented by at least one of the graphs:- positive correlation- negative correlat
Subjects:
Grades:
Not Grade Specific
Also included in: Statistics Clipart - Graphs, Secondary Grades - BUNDLE
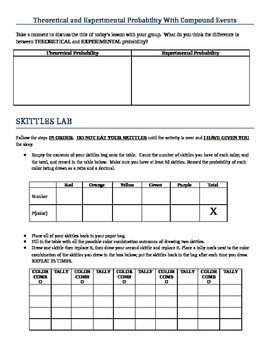
Activity for Theoretical and Experimental Probability of Compound Events
This Skittles Lab is a fun and engaging way to get students excited about finding probabilities. The experiment involves finding the theoretical and experimental probability of choosing a specific order of skittles from a bag. Students work best in groups of three to calculate their probabilities and reflect on their results. This extends what students learned about Single Event Probabilities and now involves a Compound Event. There are step-by-step instructions for students to follow through ou
Subjects:
Grades:
7th
CCSS:
Statistics Clipart - Graphs, Secondary Grades - BUNDLE
Need some graph clipart for your secondary grades statistics product? This clipart bundle includes 5 different clipart sets. You save 30% by buying them together.The graphs in each product come in a variety of options that make them perfect for making worksheets, assessments, interactive notebook activities, and interactive white board files!Options:1) labeled or unlabeled2) color/grayscale/blackline)These graphs, like ALL my clipart, can be used as moveable pieces in digital resources. No ad
Subjects:
Grades:
Not Grade Specific
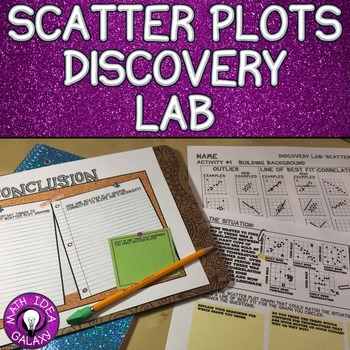
Scatter Plots Lesson - Discovery Lab
A great lesson to introduce scatter plots is by having your students participate in a discovery lab. They will get to see the topic and discover it on their own in an engaging collaborative activity.
This resource includes:
-Background Building Activity
-A Discovery Activity
-Reflections Section
Subjects:
Grades:
6th - 8th
Types:
CCSS:
Also included in: Scatter Plots Activity Bundle
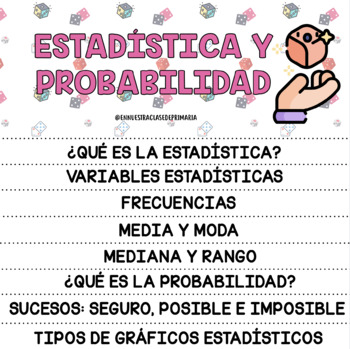
FLIPBOOK ESTADÍSTICA Y PROBABILIDAD
FLIPBOOK para trabajar los siguientes contenidos: ¿Qué es la estadística?Variables estadísticas.Frecuencias,Media y modaMediana y rango¿Qué es la probabilidad?Sucesos: seguro, posible e imposible. Tipos de gráficos.
Subjects:
Grades:
5th - 8th
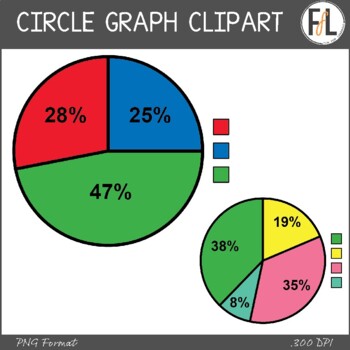
Statistics Clipart - CIRCLE GRAPHS
Need some clipart for your secondary grades statistics product? This graphics resource features 8 different circle graphs (aka: pie charts) in a variety of different options that are perfect for making worksheets, interactive notebook elements, interactive whiteboard activities and more! The graphs all have an unlabeled color key, and come in the following options:2) labeled (with numerical percentages) or unlabeled 3) color, grayscale, or blacklineThese graphs, like ALL my clipart, can be use
Subjects:
Grades:
Not Grade Specific
Also included in: Statistics Clipart - Graphs, Secondary Grades - BUNDLE
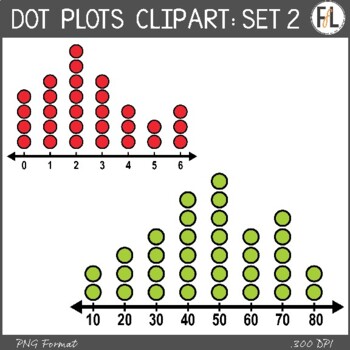
Statistics Clipart - DOT PLOTS, SET 2
Need some MORE clipart for your secondary grades statistics product? This graphics resource features 8 different dot plot graphs in a variety of different options that are perfect for making worksheets, interactive notebook elements, interactive whiteboard activities and more! This second set is designed to be a bit easier than the 1st set. The graphs all come in the following options:2) labeled or unlabeled 3) color, grayscale, or blacklineThe following distribution types are represented by
Subjects:
Grades:
Not Grade Specific
Also included in: Statistics Clipart - Graphs, Secondary Grades - BUNDLE
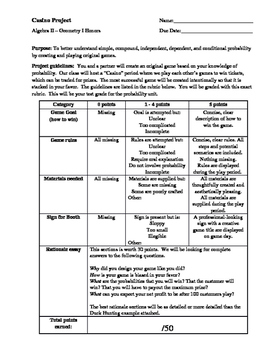
Carnival Probability Project
A project that feels like a game!
Students must create their own game, using probability to ensure THEY are favored to win....much like the house in a casino. Students can make games involving dice, spinners, cards, "fishing" ducks out of a pond, etc.
Assessed skills include: fundamental counting principal, theoretical probability, experimental probability, independent events, dependent events, creativity, writing, presentation. *Students must already know basic probability to complete this
Subjects:
Grades:
8th - 12th
Types:

Normal Distribution in a real life context: Lake Tekapo Fish Mongers
Are you having trouble explaining what Normal distribution is and how it can be used in real life? Are your students craving a hands on activity that would make sense of this concept? Do you need an engaging project on statistics? Would you like an activity that already has enrichment, scaffolding and all of the material ready to go? If you answered yes to any or all of these questions, this project is tailor made for you!Your students will assume a role of a research team for a fishing company.
Subjects:
Grades:
10th - 12th, Higher Education
Types:
CCSS:
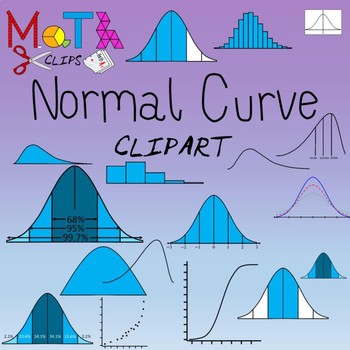
Normal Distribution Statistics Clipart
A collection of 90 images of normal curves (bell curves), labeled subdivided by standard deviation. Includes shaded distributions by standard deviation sections. Also includes examples of other skewed distributions, symmetric distributions, binomial distributions, t-distribution, chi-square. Includes cumulative distribution and probability plots for normal, negatively skewed and positively skewed distributions. Ideal for creating resources for normal distribution and empirical rule concepts
Subjects:
Grades:
Not Grade Specific
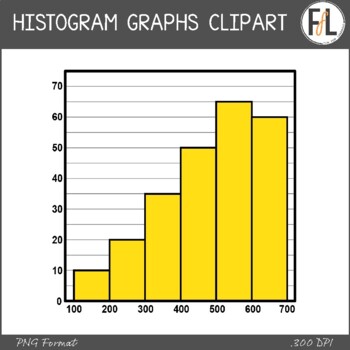
Statistics Clipart - HISTOGRAM GRAPHS
Need some clipart for your secondary grades statistics product? This graphics resource features 8 different histogram graphs in a variety of different options that are perfect for making worksheets, interactive notebook elements, interactive whiteboard activities and more! The graphs all come in the following options:1) labeled or unlabeled2) transparent background or whitefilled 3) color, grayscale, or blacklineThe following distribution types are represented by at least one of the graphs:- p
Subjects:
Grades:
Not Grade Specific
Also included in: Statistics Clipart - Graphs, Secondary Grades - BUNDLE
IM Grade 6 MathTM Guided Math Notes and Teacher Version
Here are all the notes needed for 6th grade math. This product included the student and teach version of the notes. This resource is based on the IM K-12 MathTM authored by Illustrative Mathematics® and offered under a CC BY 4.0 License.
Subjects:
Grades:
6th
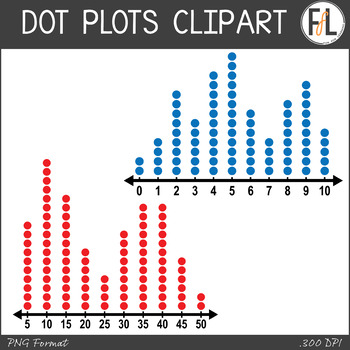
Statistics Clipart - DOT PLOTS, SET 1
Need some clipart for your secondary grades statistics product? This graphics resource features 8 different dot plot graphs in a variety of different options that are perfect for making worksheets, interactive notebook elements, interactive whiteboard activities and more! The graphs all come in the following options:2) labeled or unlabeled 3) color, grayscale, or blacklineThe following distribution types are represented by at least one of the graphs:- positive distribution- negative distributi
Subjects:
Grades:
Not Grade Specific
Also included in: Statistics Clipart - Graphs, Secondary Grades - BUNDLE
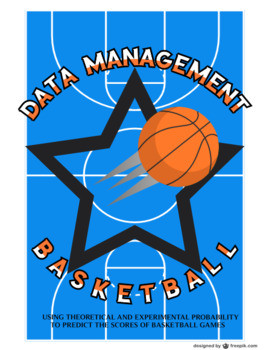
The Ultimate Basketball Learning Activity & Game - Data Management & Probability
DATA MANAGEMENT AND BASKETBALL!Can be used as a performance task for Data Management and Number Sense and Numeration! Want an exciting and fun activity to get students interested in Data Management? This is the resource for you! Combining competitive gameplay, exciting research, and fun this activity is a surefire way to get your class interested in Data Management. You'll create player profiles and using experimental probability determine the outcome of basketball games played between your
Subjects:
Grades:
5th - 12th, Adult Education
Types:
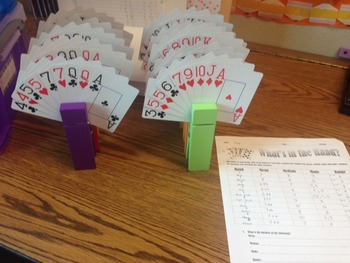
Statistics Mode, Median, Mean, Range Worksheet for Math or Psychology
What's in the Hand: Activity makes learning mode, median, mean, and range fun. You will need two packs of playing cards in order to use 10 different variations. I use giant clothes pins to hold a total of 9 cards for each station. Each student gets a worksheet and is assigned to a group of 4-5 students. Students will complete the first rotation by figuring the mean, median, mode, and range, and then rotate to each other station in about 5 min intervals. At the end they will answer the questions
Subjects:
Grades:
5th - 12th

Casino Probability Project
Have your students demonstrate their understanding of probability by setting up a casino in your classroom with games created by the students. The casino currency can be candy, manipulative counters, or pennies (to be returned at the end of class).
Subjects:
Grades:
7th - 12th
Types:
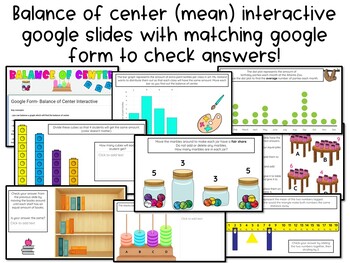
Balance of Center | Mean as Fair Share Interactive Google Slides w/ Google Form
18 slides of different interactive activities giving students an opportunity to move around online math manipulatives to find the balance of center and mean as fair share. There is a google form that goes along with the slides so students can get instant feedback. Examples:- balancing a bar graph- balancing a dot plot- sharing money to find the fair share between four friends- moving marbles around in different jars to find the mean of marbles per jar- moving snap cubes to balance the four grou
Subjects:
Grades:
3rd - 8th
Types:
Which Quarterback is the G.O.A.T.? - Using Statistical Calculations
Note: This is an upgraded version of the Statistical Analysis Using Football (QB) Stats. If you have previously purchased this resource please email me and I will send you the updated version.This project has students calculate percents, averages, and ratios, as well as create scatterplots, box and whisker plots, and histogram (bar graphs) based on their calculations.Google slideshow includes 12 well know Hall of Fame quarterbacks including Joe Namath, Roger Staubach, Terry Bradshaw, Joe Montana
Subjects:
Grades:
6th - 9th
CCSS:
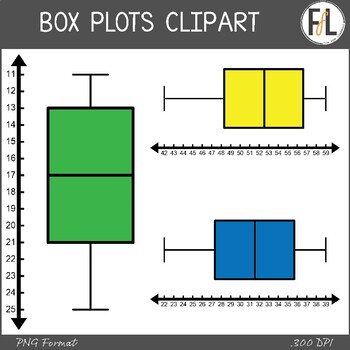
Statistics Clipart - BOX PLOTS
Need some clipart for your secondary grades statistics product? This graphics resource features 8 different box plot graphs (aka: box and whisker plots) in a variety of different options that are perfect for making worksheets, interactive notebook elements, interactive whiteboard activities and more! The graphs all come in the following options:1) vertical or horizontal2) labeled or unlabeled3) color, grayscale, or blacklineThese graphs, like ALL my clipart, can be used as moveable pieces in d
Subjects:
Grades:
Not Grade Specific
Also included in: Statistics Clipart - Graphs, Secondary Grades - BUNDLE
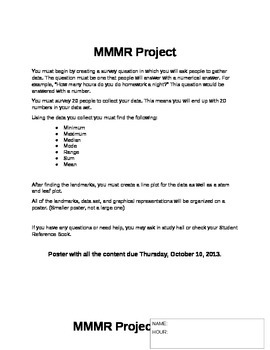
Mean, Median, Mode, and Range Project
This includes the instructions to give to the students as well as the rubric for grading the project. They must gather their own data and then complete the calculations using the data they collected.
Subjects:
Grades:
5th - 7th
Showing 1-24 of 146 results


