35 results
Statistics pdfs by TpT sellers for TpT sellers

Teacherpreneur Data Insights - TPT Seller Business Tracker Analysis Spreadsheets
Welcome to Teacherpreneur Data Insights – a business data tracker designed to elevate your teacher seller journey. Gain actionable insights, track trends, and optimize your strategies with this comprehensive tool. In a world where data is powerful, this guidebook and Google Sheets combo empowers you to navigate your TPT store effectively. Seamlessly analyze your metrics, make informed decisions, and propel your store to new heights. Utilize this powerful tool to identify your best-selling produc
Subjects:
Grades:
Not Grade Specific
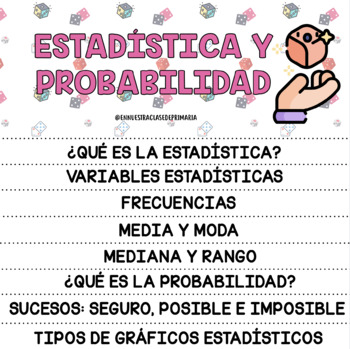
FLIPBOOK ESTADÍSTICA Y PROBABILIDAD
FLIPBOOK para trabajar los siguientes contenidos: ¿Qué es la estadística?Variables estadísticas.Frecuencias,Media y modaMediana y rango¿Qué es la probabilidad?Sucesos: seguro, posible e imposible. Tipos de gráficos.
Subjects:
Grades:
5th - 8th
Sequences and Series Worksheets Algebra 2
Series WorksheetsThis is a graphical preview of the Sequences and Series Worksheets. You can customize these worksheets by selecting various variables to meet your specific needs. Each worksheet is randomly generated, ensuring an endless supply of unique and high-quality materials for classroom or home use. Our collection includes general sequences, arithmetic sequences, geometric sequences, comparisons of arithmetic and geometric sequences, general series, arithmetic series, arithmetic and geom
Subjects:
Grades:
8th - 12th
Find the Error - Data and Graphs with Central Tendency and Variation
This is an activity that I created for my students to find the mistake when a student has answered questions from graphs about measures of center and variation incorrectly. I used common errors to help them see the mistakes commonly made. All of my products are common core aligned.I had the students work alone to solve the problems first, and then share with their groups. If there was any discrepancy, they looked in the answer folder on their tables to see the correct answer. I rotated around
Subjects:
Grades:
5th - 7th
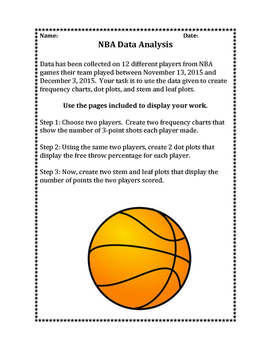
4th grade Data Analysis: Frequency Charts, Dot Plots, and Stem-and-Leaf Plots
This activity uses real NBA data to engage students in analyzing data. Students use data from 10 games of 12 players to create frequency charts, dot plots, and stem-and-leaf plots. Questions included allow students to reflect and analyze their work. Sure to grab your students' attention!
Subjects:
Grades:
4th
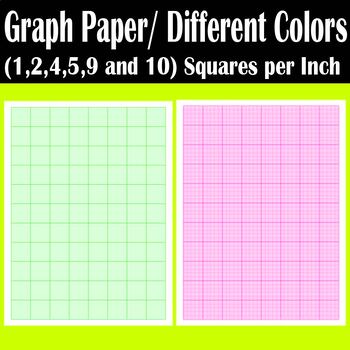
(1,2,4,5,9 and 10) Squares per Inch Graph Paper/ Different Colors Format A4.
This Packet Includes 12 Pages Of Colorful Graphing Paper Multi Squares.This Graph Paper Is Great To Use:- For Math Problems! Simply Place One Number in Each Box and Line Them up So Numbers Are Easily Read and There’s A Spot for Each Number in Your Answer.- For Analysis! If You Are In Need Of Doing Analysis Of Any Stuff Or Want To Find Out The Structural Data Then In Such Conditions You Need The Graph.- For Presentation! If You Are In Need Of Presenting Any Presentation Related To Statistical Dat
Subjects:
Grades:
Not Grade Specific
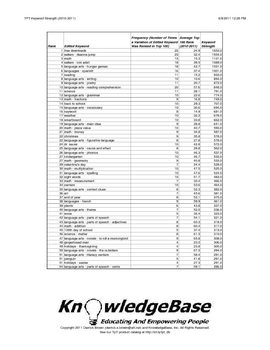
TPT KeyWord Strength Index (2010-2011) - Downloadable PDF!
What are the strongest keywords on TpT?
1. free downloads
2. Deanna Jump
3. math
Neither #1 nor #2 are surprises, but #3 (math) was certainly a surprise to me!
This report analyzes TpT's 2010-2011 keywords using a measure called "keyword strength".
The measure is based on a keyword's average rank, as well as the number of times it appeared in the 2010-2011 "Top 100" TpT search engine rankings.
This can be a valuable tool to help sellers understand TpT's marketplace supply and demand!
The P
Subjects:
Grades:
PreK - 12th, Higher Education, Adult Education, Staff
36:46
Be Your Own TpT Data Whiz - TpT Conference Video
Have you struggled to try to understand your TpT Data? Sometimes looking at the product stats and the dashboard can be a bit daunting. This video is from the TpT Forward 21 conference and it is full of great information to help you understand everything you need to know about conversion rates, optimization rates, and so much more!This video will:keep you from falling asleep (no boring data talk here!)explain data in an easy-to-understand way!explain conversion ratesexplain optimization rates (vi
Subjects:
Grades:
Not Grade Specific
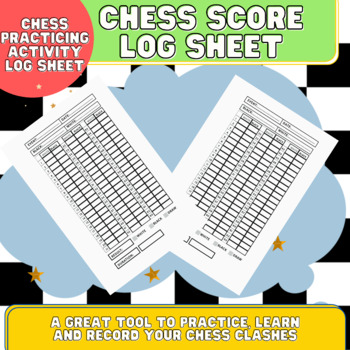
Back To School Chess Score Sheet | Chess Reference Cards | Chess Reference
With this simple organized log sheet you can record all your games, learn how to practice chess and improve your skills.You can track your general results in all chess clashes and games just in the case to learn more about chess playing style.I created this product because of the importance of learning chess in home school or in school as it's a mind improving game that allows kids and students to improve their own skills and mind capacities.You can keep it in your bag without any problems and
Subjects:
Grades:
Not Grade Specific
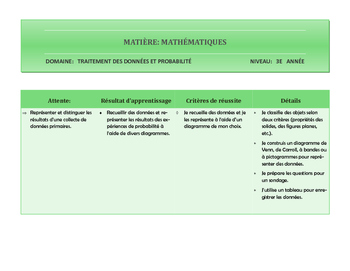
Résultats d'apprentissage et critères d'évaluation TDP 3e année
Ce document, conçu à l’intention des enseignant (e)s, comprend les résultats d’apprentissage et les critères de réussite (évaluation) avec des détails qui couvrent toutes les attentes du programme cadre de mathématiques de l’Ontario en traitement de données et probabilité.
Il est prêt à être utilisé tel quel ou il peut servir comme source d’inspiration pour les grilles d’évaluation adaptées, pour les tableaux en T, pour des situations d’apprentissage spécifiques selon les besoins des élèves, e
Subjects:
Grades:
3rd
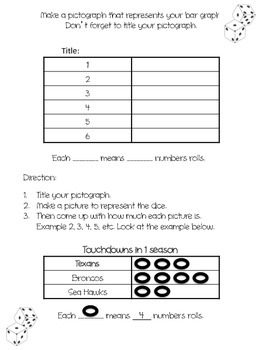
Make your Bar graph and Pictograph
This can be used for a station, practice, or part of your lesson.
Students role a dice to make their own graph and then turn it into a pictograph.
There is a graph for the dice, a pictograph table, with an example, and generic questions to go along with the students dice graph.
It covers TEKS 3.13A, 3.13B and 3.13C
If you want just the blank graph or pictograph, please message me or email me and I will send it to you!
Enjoy!
Make your own bar graph and pictograph by Patricia Freitag Fons
Subjects:
Grades:
2nd - 4th
Dice Bulletin Board Letters
These dice themed alphabet letter will brighten up your bulletin board display. All 26 alphabet letters are included in an uppercase font, as well as numerals 0-9 and punctuation. Letters are approximately 6 inches tall. Just print what you need and enjoy. Be sure to check out my other fun, themed letters in my store.
Subjects:
Grades:
PreK - 12th, Higher Education, Adult Education, Staff
Statistics Vocabulary TEKS Aligned
This product includes several vocabulary words for a statistics unit. There are three graphs that will be able to cut and match, along with definitions of vocabulary words.
This is aligned with the Texas TEKS
6.12B 6.12C 6.12D 6.13B
I hope this can be useful to you and your students!
Stop by my store for some free fonts!
S&S Designs
https//www.teacherspayteachers.com/Store/S-And-S-Designs
Subjects:
Grades:
6th - 9th
Mean, Median, & Mode plus a QR code
Students solve questions about Mean, Median, and Mode then check their answers using their iPads to scan the QR code.
There are only 6 word problems in this set, but I have found that, because each problem takes a rather long time, students only have the stamina (and the time during class) for a few of these.
Subjects:
Grades:
4th - 6th
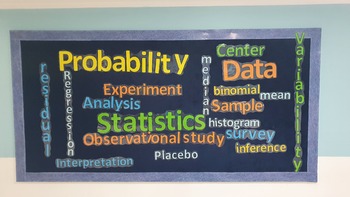
Statistics / AP Statistics Word Cloud Bulletin Board
The product is a word cloud for Statistics / AP Statistics.It is a PDF documents of the letters of different sizes forming the words shown in the bulletin board. ( few more words are in the document but not on the board). The colored used in the document are 5 named as color 1, color 2 .... at the bottom of the page. You can choose your own colors.For time saving, use a cricut or similar device if available.Best of luck!
Subjects:
Grades:
11th - 12th, Higher Education, Adult Education
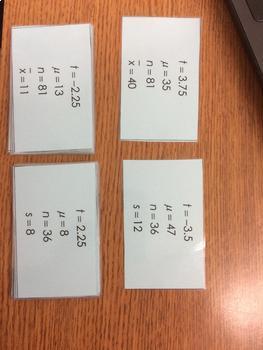
t-statistic "Find Your Match" Activity
PLEASE RATE! :) My Statistics students needed practice when they first learned how to calculate a t-statistic. I came up with this activity that requires students to work backwards using the t-statistic formula to either find the sample mean or the sample standard deviation.
Each student will have different numbers, but two of the cards will have the same sample mean and same sample standard deviation. Once the student solves for the missing statistic, they will walk around and find anothe
Subjects:
Grades:
11th - 12th
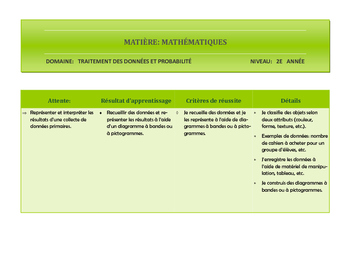
Résultats d'apprentissage et critères d'évaluation TDP 2e année
Ce document, conçu à l’intention des enseignant (e)s, comprend les résultats d’apprentissage et les critères de réussite (évaluation) avec des détails qui couvrent toutes les attentes du programme cadre de mathématiques de l’Ontario en traitement de données et probabilité.
Il est prêt à être utilisé tel quel ou il peut servir comme source d’inspiration pour les grilles d’évaluation adaptées, pour les tableaux en T, pour des situations d’apprentissage spécifiques selon les besoins des élèves, e
Subjects:
Grades:
2nd
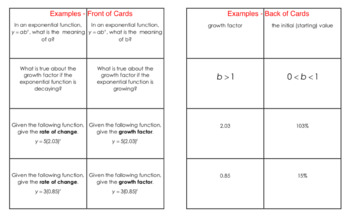
Exponential Models & Log Rules Activity
This activity allows students to quickly quiz one another (or even themselves) on exponential models and log rules. To be successful, students will need to know the meaning of each part of the exponential formula y=ab^x. Students will also need to be able to find the initial value, growth factor and growth rate from both an equation and a graph. Students will test their skills at converting a logarithmic equation to an exponential model and vice versa. There are a total of 32 different cards
Subjects:
Grades:
10th - 12th
CCSS:
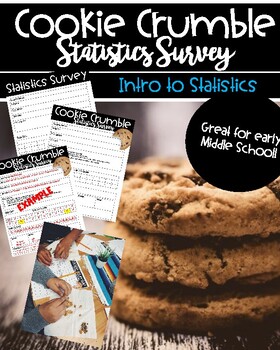
Statistics Survey-Cookie Crumble
Chocolate chip cookies aren't just a favorite after-school snack. They're also a rich source of statistical data! Kick off your Statistics Unit with some Chips Ahoy! For this activity you will need a chocolate chip cookie (any brand works) for each student or pair of students. Each student crumbles up a cookie and counts the number of whole chips. Students then collect the data from their classmates and use the data set to find the Range, Mean, Median and Mode. It is also really fun to compare y
Subjects:
Grades:
5th - 7th, Staff

Line Plot foldable notes
Line plot foldable with key. Use this to create notes on how to make a line plot and how to analyze them. Easy to use and neatly organized.
Subjects:
Grades:
6th
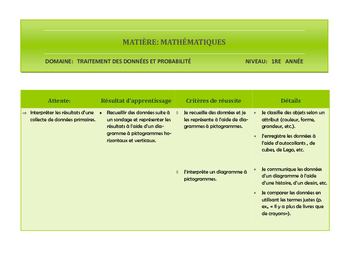
Résultats d'apprentissage et critères d'évaluation TDP 1re année
Ce document, conçu à l’intention des enseignant (e)s, comprend les résultats d’apprentissage et les critères de réussite (évaluation) avec des détails qui couvrent toutes les attentes du programme cadre de mathématiques de l’Ontario en traitement de données et probabilité.
Il est prêt à être utilisé tel quel ou il peut servir comme source d’inspiration pour les grilles d’évaluation adaptées, pour les tableaux en T, pour des situations d’apprentissage spécifiques selon les besoins des élèves, e
Subjects:
Grades:
1st
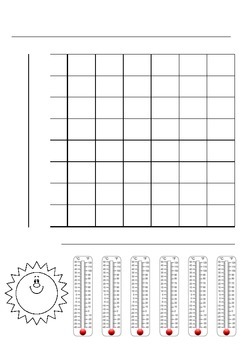
Graphing Temperature Worksheet
This is a great worksheet where children are required to collect the temperature each day and graph the results. Students will be required to label the different parts of the graph.
Subjects:
Grades:
2nd - 5th
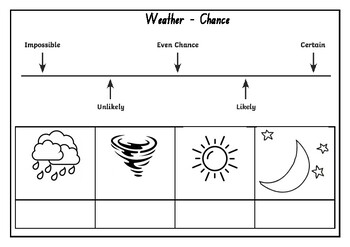
Chance - Weather
Get students to use chance to write the probability of the weather for the day.
Subjects:
Grades:
PreK - 2nd
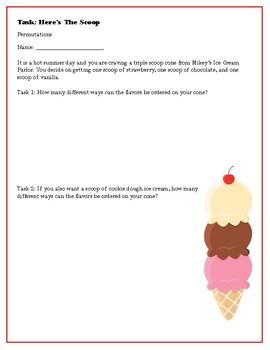
Permutation Task: Here's the Scoop
Use this task to teach about permutations. It is fun and will lead to a great discussion on different methods to deal with ordering a set of items.
Subjects:
Grades:
3rd - 8th
Showing 1-24 of 35 results


