4,893 results
Statistics resources for homeschool
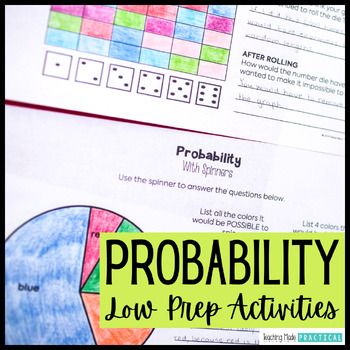
Probability Activities - Fun Review Worksheets, Spinners, Dice, Task Cards
These low prep probability activities and worksheets make a great introduction or review. Students will practice probability vocabulary - certain, impossible, possible, likely, unlikely, and equally likely - and apply these words in a variety of situations and events. Students will also get the opportunity to think about different probability events with hands on practice using spinners, coins, and dice. The fun probability activities include: 6 anchor charts / probability posters to help stu
Subjects:
Grades:
2nd - 5th
Types:
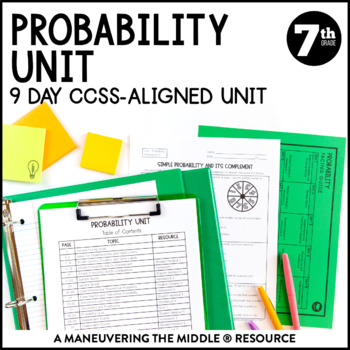
Probability Unit | Independent and Dependent Events | 7th Grade Math Notes
A 9 day CCSS-Aligned Probability Unit - including simple probability, experimental and theoretical probability, making predictions, and independent and dependent probability.Students will practice with both skill-based problems, real-world application questions, and error analysis to support higher level thinking skills. You can reach your students and teach the standards without all of the prep and stress of creating materials!Standards: 7.SP.5, 7.SP.6, 7.SP.7, 7.SP.8; Texas Teacher? Grab the T
Subjects:
Grades:
7th
Types:
Two Way Relative Frequency Tables Worksheet
Are you a math teacher looking for engaging classwork or homework activities to help your students with relative frequency tables? Look no further! Our worksheet on completing two-way tables and creating relative frequency tables is perfect for your needs. Great for Pre-Algebra and Algebra 1 students. With real-world situations and comprehension questions based on relative frequency tables, students will learn to summarize and interpret data collected from the same subjects. They'll construct an
Subjects:
Grades:
8th - 9th
Types:
CCSS:
Also included in: Scatterplots Two Way Tables and Residual Plots Worksheets Bundle
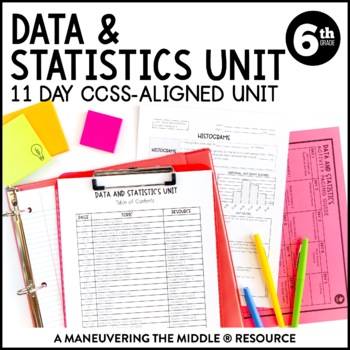
Data & Statistics Unit | Measures of Center, Dot and Box Plots, & Histograms
An 11 day CCSS-Aligned Statistics Unit - including statistical questions, describing data, and analyzing data with dot plots, box plots, and histograms. Students will understand measures of center and variability and how they relate to displays of data. Students will practice with both skill-based problems, real-world application questions, and error analysis to support higher level thinking skills. You can reach your students and teach the standards without all of the prep and stress of creatin
Subjects:
Grades:
6th
Types:
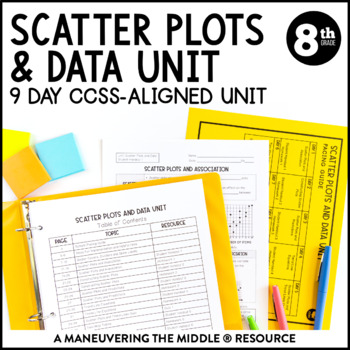
Scatter Plots and Data Unit | 8th Grade Math | Line of Best Fit Notes
A 9 day CCSS-Aligned Scatter Plots and Data Unit - including scatter plots, trend lines, two-way tables and relative frequency.Students will practice with both skill-based problems, real-world application questions, and error analysis to support higher level thinking skills. You can reach your students and teach the standards without all of the prep and stress of creating materials!Standards: 8.SP.1, 8.SP.2, 8.SP.3, 8.SP.4; Texas Teacher? Grab the TEKS-Aligned Scatter Plots and Data Unit. Please
Subjects:
Grades:
8th
Types:
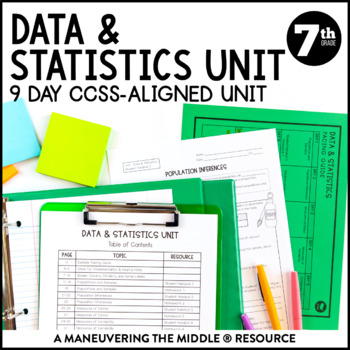
Data and Statistics Unit | Random Sampling, Dot Plot, & Box Plot 7th Grade Notes
A 9 day CCSS-Aligned Statistics Unit - including populations and samples, drawing inferences from samples, measures of centers and variability, comparing and analyzing dot and box plots. Students will practice with both skill-based problems, real-world application questions, and error analysis to support higher level thinking skills. You can reach your students and teach the standards without all of the prep and stress of creating materials!Standards: 7.SP.1, 7.SP.2, 7.SP.3, 7.SP.4; Texas Teache
Subjects:
Grades:
7th
Types:
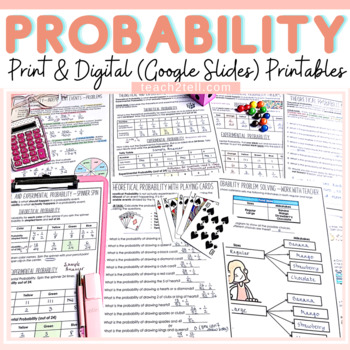
Chance and Probability Activities Print and Digital Worksheets |Google Classroom
Are you teaching your students all about chance and probability and looking for fun hands-on probability activities? This print and digital (google slides) bundle of probability worksheets will reinforce the understanding of theoretical probability, experimental probability, language of chance, sample space, predictions, lists, tree diagrams, dependent probability events and independent probability events.Both US and British English spelling and terminology included.Overview of Activities1. The
Subjects:
Grades:
4th - 8th
Types:
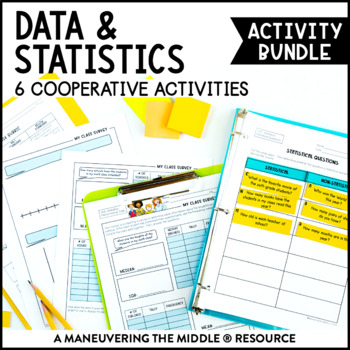
Data & Statistics Activity Bundle | Measures of Center, Histograms, & Box Plots
This Data and Statistics Activity Bundle includes 6 classroom activities to support statistical questions, histograms, box plots, measures of center and measures of variability. These hands-on and engaging activities are all easy to prep! Students are able to practice and apply concepts with these data and statistics activities, while collaborating and having fun! Math can be fun and interactive! Standards: CCSS (6.SP.1, 6.SP.2, 6.SP.3, 6.SP.4, 6.SP.5) and TEKS (6.12A, 6.12B, 6.12C, 6.12D, 6.13
Subjects:
Grades:
5th - 7th
Types:
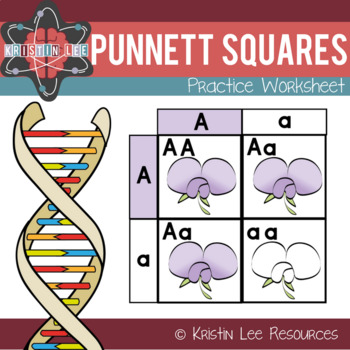
Punnett Squares Practice Worksheet
This is a worksheet I used with my 7th graders during a Genetics unit. We had just gone over probability and Punnett Squares. This was the first practice that they had to do on their own. Background knowledge required. The worksheet consists of filling in Punnett squares and using them to determine the probabilities of different traits. There are 5 problems and 2 conclusion questions.This worksheet also comes with the bundle "Probability in Genetics PPT w/ Notes and Punnett Worksheet" if you
Subjects:
Grades:
6th - 8th
Types:
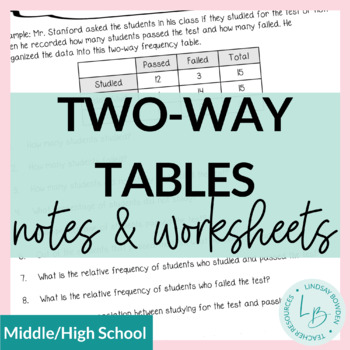
Two-Way Frequency Tables Notes and Worksheets
These two-way frequency table notes and worksheets are meant for an Algebra 1 statistics unit. However, they can also be used in middle school. They cover:Reading two-way frequency tablesFinding joint, marginal, and conditional relative frequenciesCreating two-way frequency tablesSee preview to view all pages! 4 pages + answer keys.You may also like:Two-Way Frequency Tables Task CardsBox and Whisker Plots Notes & WorksheetsHistograms Notes & WorksheetsTerms of Use:This product should onl
Subjects:
Grades:
8th - 10th
CCSS:
Also included in: Statistics Unit Bundle
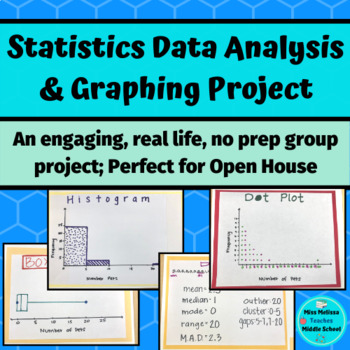
Statistics Project: Data Analysis & Graphing- real life, no prep
This statistics project is intended as a closure for your sixth grade statistics unit and aligns with ALL of the sixth grade statistics and probability common core state standards. In groups, students work together to choose a statistical question to ask the class. Once the class is surveyed, the group works together to create a frequency table, a dot plot, a histogram, and a box and whiskers plot. After creating their graphs, the groups analyze their data by looking at the mean, median, mode ra
Subjects:
Grades:
6th - 7th
Types:
Probability Activities MEGA Pack of Math Worksheets and Probability Games
Probability Activities MEGA Pack of Math Worksheets and Probability Games - Over 50 pages of math stations, worksheets, activities, and visuals to teach young learners about probability in fun, hands-on ways!
This packet includes:
- 10 probability vocabulary classroom posters
- 12 various probability worksheets
- 7 hands-on math stations
CHECK OUT THE FREE PREVIEW! Click "Download Preview" under the price :)
This pack is jam-packed! It's really hard to find quality probability worksheets and
Subjects:
Grades:
K - 3rd
Types:
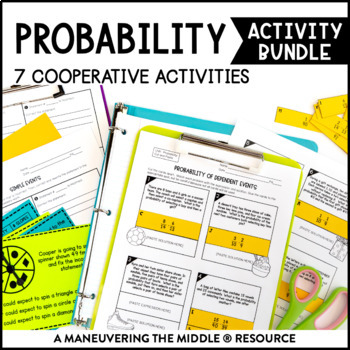
Probability Activity Bundle | Experimental & Theoretical Probability Activities
This Probability Activity Bundle includes 7 classroom activities to determine simple probability, compare experimental and theoretical probability, make predictions, determine independent probability, and find dependent probability. These hands-on and engaging activities are all easy to prep! Students are able to practice and apply concepts with these probability activities, while collaborating and having fun! Math can be fun and interactive!Standards: CCSS (7.SP.5, 7.SP.6, 7.SP.7, 7.SP.8) and
Subjects:
Grades:
7th
Types:
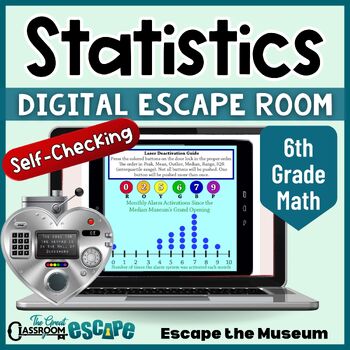
6th Grade Math Data Analysis & Statistics Activity Digital Escape Room Game
Find the median, read the box plot, interpret the frequency table, and unlock the door! This 6th grade math activity based on statistics and probability standards will put your students statistical skills to the test. Your students are volunteer docents at the Median Museum. After the security system locks everyone in, they will need to use their knowledge of statistics to escape the museum. This engaging digital escape room is easy for teachers to implement. The breakout process is fully autom
Subjects:
Grades:
6th - 7th
Types:
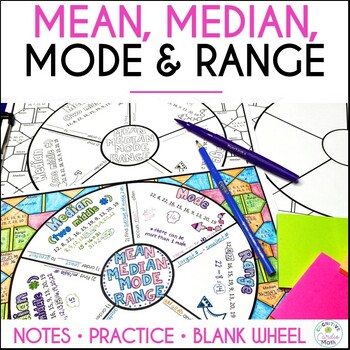
Mean, Median, Mode, Range Math Doodle Wheel | Notes and Practice Activity
Use this mean, median, mode, range doodle math wheel for notes and practice. Introduce each data measurement type as you teach it, or, you can use the math wheel to review all of them at once.What is a math wheel? A math wheel is a type of graphic organizer where students can:Take notes/guided notes inside the math wheelUse color, drawing, and doodling to help create memory triggersComplete practice problems in the pattern around the wheel, andColor the background patternStudents can keep these
Subjects:
Grades:
4th - 6th
Also included in: Mean, Median, Mode, Range Activity Bundle Math Centers
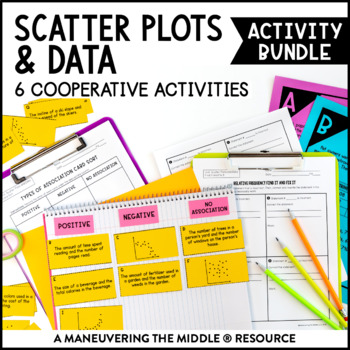
Scatter Plots and Data Activity Bundle | Trend Lines Activities for 8th Grade
This Scatter Plots and Data Activity Bundle includes 6 classroom activities to support 8th grade scatter plots and two-way tables. These hands-on and engaging activities are all easy to prep! Students are able to practice and apply concepts with these scatter plots and two-way table activities, while collaborating and having fun! Math can be fun and interactive!Standards: CCSS (8.SP.1, 8.SP.2, 8.SP.3, 8.SP.4) and TEKS (8.5C, 8.5D, 8.11A)More details on what is included:Six hands-on activities t
Subjects:
Grades:
8th
Types:
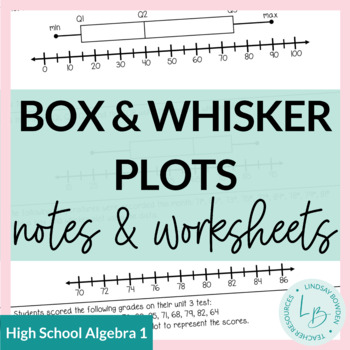
Box and Whisker Plots Notes and Worksheets
These notes and worksheets cover:RangeQuartiles and Interquartile RangeBox and Whisker PlotsIncludes 2 pages of notes and 2 worksheets. Answer keys included! These are meant for an Algebra 1 class, but can also be used for middle school (Texas standards for 7th grade). You may also like:Mean, Median, and Mode Notes & WorksheetsHistograms Notes & WorksheetsComparing Data: Spread, Shape, and Center Notes & WorksheetsTerms of Use:This product should only be used by the teacher who purch
Subjects:
Grades:
8th - 10th
CCSS:
Also included in: Statistics Unit Bundle
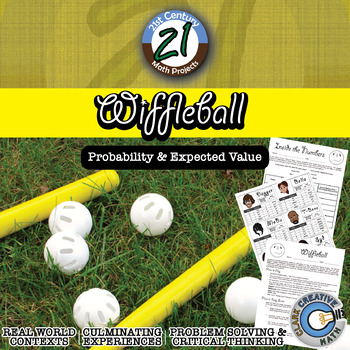
Wiffleball -- Theoretical & Experimental Probability - 21st Century Math Project
Theoretical and Experimental Probability gets a 21st Century Math Project facelift in this interactive game. Tired of flipping coins and spinning spinners? Students play the role of team managers and with only player statistics they must build a team capable of winning the championship. Students will plays a series of Wiffleball games where they will keep track of statistics using a baseball/softball inspired scorebook and after the game crunch the number to see if their players performed up to
Subjects:
Grades:
6th - 12th
Types:
Also included in: Probability & Expected Value Unit Bundle - Distance Learning Compatible
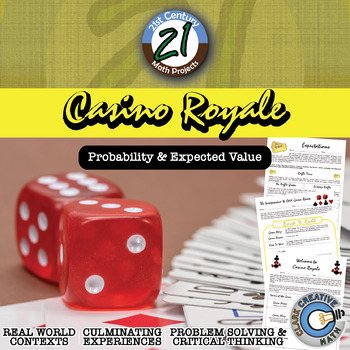
Casino Royale -- Expected Value & Probability Game - 21st Century Math Project
Your students might be begging for for a day for them to play games. Let it be on your terms in this 21st Century Math Project! This Expected Value and Probability Project focuses on one of the more emphasized aspects of the Common Core Standards. Students will be asked to design their own games with defined expected value and host it in a Game Day event! The student that collects the most "Swagg Cash" will forever (or at least for 36 hours) be known as the Master of Swagg. ***THIS PRODUCT HAS B
Subjects:
Grades:
6th - 12th
Types:
CCSS:
Also included in: Probability & Expected Value Unit Bundle - Distance Learning Compatible
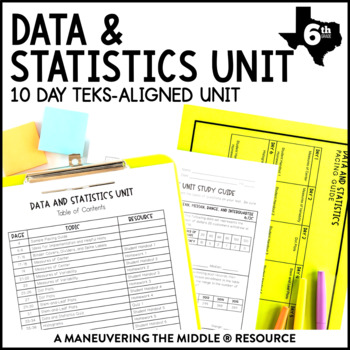
Data and Statistics TEKS Unit | Stem & Leaf Plots, Histograms, Frequency Tables
A 10 day Data and Statistics TEKS-Aligned complete unit including: measures of center, measures of variability, dot plots, stem-and-leaf plots, histograms, and categorical data.Students will practice with both skill-based problems, real-world application questions, and error analysis to support higher level thinking skills. You can reach your students and teach the standards without all of the prep and stress of creating materials!Standards: TEKS: 6.12A, 6.12B, 6.12C, 6.12D, 6.13A, 6.13B; Lookin
Subjects:
Grades:
6th
Types:
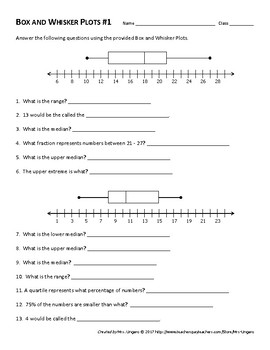
Box and Whisker Plot Worksheets
This product contains TWO Box-and-Whisker Plot worksheets.
Both worksheets requires students to read, interpret, and create Box-and-Whisker plots. Students will first be asked to find lower and upper extremes, range, and all three medians. Following this, students will be creating their own Box-and-Whisker Plots using the information provided.
Worksheet #1 is slightly easier than worksheet #2. This can be used to cover multiple days of instruction or to differentiate within the classroom.
Subjects:
Grades:
5th - 8th
Types:
CCSS:
SAT Math Test Prep Bundle
Updated for 2024! If you are preparing students for college entrance exams in math for the SAT or PSAT, then this will be a life saver! This is a bundle of all 6 of my SAT reviews. As high school math teachers, we should be preparing our students to succeed on college entrance exams. The students need to become familiar with the types of questions they will see and how they will be asked. Read further to see the topics and a little about each activity below:Some of the topics covered are:Systems
Subjects:
Grades:
10th - 12th
Types:
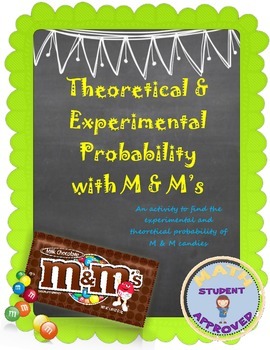
Theoretical and Experimental Probability M&M activity
Students need to find the probability of picking certain colored M&Ms, and asked to change them into decimals, fractions, and percents. They are asked to draw specific M&Ms at random for experimental probability problems. They are asked to make a few predictions, as well. This is a lengthy lesson and takes a while to get through, so make sure you have enough time to get through it. It can be done in 2 days, and if you need to use colored chips or counters instead, go for it!
Subjects:
Grades:
5th - 11th
Types:
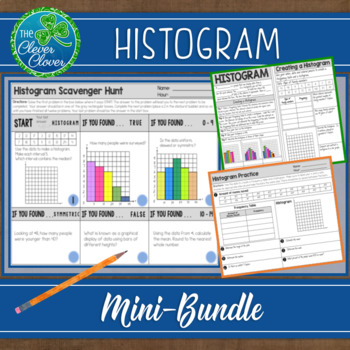
Histogram - Notes, Practice Worksheets and Scavenger Hunt
This histogram resource includes guided notes, a practice worksheet and a scavenger hunt. Your students will have the opportunity to create, interpret and discuss histograms. Below, you will find a detailed description of the notes, worksheet and scavenger hunt. Guided NotesThere are two small pages of guided notes. The first page provides the definition of a histogram and step by step instructions on how to create a histogram. The bottom portion of the notes has students examine three types (un
Subjects:
Grades:
6th - 9th, Adult Education
CCSS:
Also included in: Statistics Bundle - Guided Notes, Worksheets & Scavenger Hunts!
Showing 1-24 of 4,893 results


