5 results
Statistics resources by TpT sellers for TpT sellers $10 and up

Teacherpreneur Data Insights - TPT Seller Business Tracker Analysis Spreadsheets
Welcome to Teacherpreneur Data Insights – a business data tracker designed to elevate your teacher seller journey. Gain actionable insights, track trends, and optimize your strategies with this comprehensive tool. In a world where data is powerful, this guidebook and Google Sheets combo empowers you to navigate your TPT store effectively. Seamlessly analyze your metrics, make informed decisions, and propel your store to new heights. Utilize this powerful tool to identify your best-selling produc
Subjects:
Grades:
Not Grade Specific
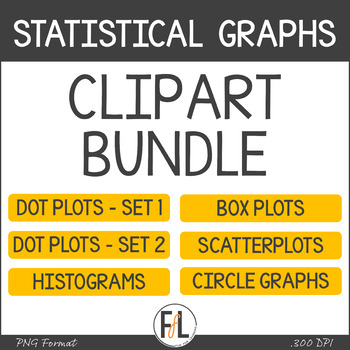
Statistics Clipart - Graphs, Secondary Grades - BUNDLE
Need some graph clipart for your secondary grades statistics product? This clipart bundle includes 5 different clipart sets. You save 30% by buying them together.The graphs in each product come in a variety of options that make them perfect for making worksheets, assessments, interactive notebook activities, and interactive white board files!Options:1) labeled or unlabeled2) color/grayscale/blackline)These graphs, like ALL my clipart, can be used as moveable pieces in digital resources. No ad
Subjects:
Grades:
Not Grade Specific
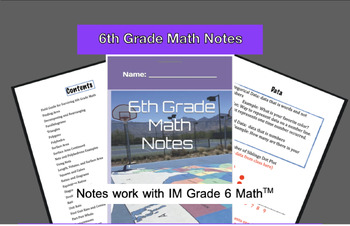
IM Grade 6 MathTM Guided Math Notes and Teacher Version
Here are all the notes needed for 6th grade math. This product included the student and teach version of the notes. This resource is based on the IM K-12 MathTM authored by Illustrative Mathematics® and offered under a CC BY 4.0 License.
Subjects:
Grades:
6th
Which Quarterback is the G.O.A.T.? - Using Statistical Calculations
Note: This is an upgraded version of the Statistical Analysis Using Football (QB) Stats. If you have previously purchased this resource please email me and I will send you the updated version.This project has students calculate percents, averages, and ratios, as well as create scatterplots, box and whisker plots, and histogram (bar graphs) based on their calculations.Google slideshow includes 12 well know Hall of Fame quarterbacks including Joe Namath, Roger Staubach, Terry Bradshaw, Joe Montana
Subjects:
Grades:
6th - 9th
CCSS:
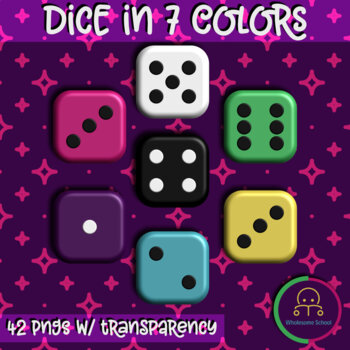
42 Dice in 7 Colors | PNG Transparency | Graphics for Math, Games, Statistics
Create fun activities for your students with these digital die images. Each dice has a 3D effect giving them a more realistic look as opposed to a flat design. (Please view the thumbnails and preview PDF.)Each die is 1000 x 1000 px PNG image with transparency (transparent background). You can add your own effects like drop shadows in whatever graphic design software you're using.What you'll get in the zip folder:7 folders (one for each color set)each folder has 6 images (die 1 - 6)License/Terms
Grades:
1st - 3rd, Not Grade Specific
Showing 1-5 of 5 results


