300 results
Statistics homeschool curricula by TpT sellers for TpT sellers
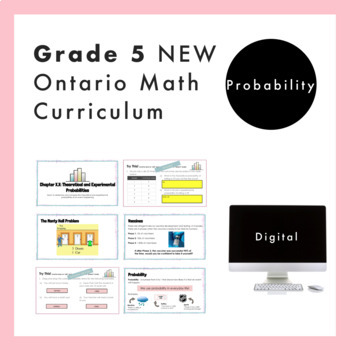
Grade 5 Ontario Math - Probability Curriculum - Digital Google Slides+Form
Are you planning for the NEW Grade 5 Ontario Math Curriculum? This fully editable, NO PREP Google Slide resource is what you need! This resource is for the DATA strand and covers all specific expectations for “D2. Probability”. In this resource, students will experience math through engaging real-life questions, storytelling through math, and interactive slides. For teachers who are given Nelson© Math by your board, this resource loosely follows the order of the Probability chapter (Chapter 13)
Subjects:
Grades:
4th - 6th
Also included in: Grade 5 NEW Ontario Math Curriculum Full Year Digital Slides Bundle
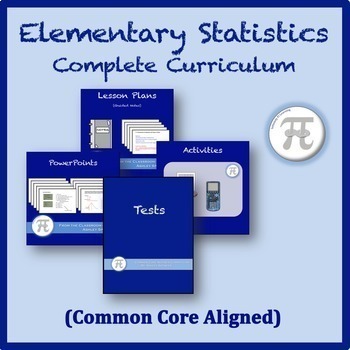
Elementary Statistics Complete Curriculum
VIEW FULL PREVIEW VIDEO HERE: https://youtu.be/eRPmKXVrmw4*Video Note: This video was made before changing to the bundle format, so the setup is a little different. Each section is an individual zipped file instead of being organized into folders. Quizzes and other extras can be found in the Bonus Content folder.Elementary Statistics Complete Curriculum (One Semester)This bundle includes everything in my Elementary Statistics Curriculum.The Complete Curriculum Includes:-Lessons with Lecture Note
Subjects:
Grades:
10th - 12th, Higher Education
Types:
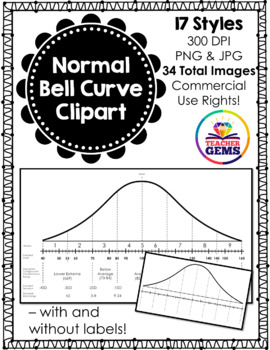
Normal Bell Curve (Normal Distribution) Clipart
Normal Bell Curve (Normal Distribution) Clipart: This Normal Bell Curve (Normal Distribution) clipart set includes 17 distinct styles (6 blank styles and 11 styles with scores) that come in both PNG (transparent) and JPEG (white background) for a total of 34 images. All image files are 300dpi. Commercial use is allowed with proper credit given (see my Terms of Use in the download – or read prior here). Below is a breakdown of all the images included in this product.Normal Bell Curve (NBC) Table
Subjects:
Grades:
Not Grade Specific
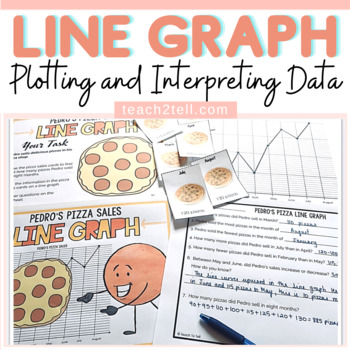
Line Graph Activity | Plotting and Interpreting Data on a Line Graph
Looking for a line graph activity that involves plotting and interpreting data on a line graph? Your students will enjoy this hands-on center activity that involves recording pizza sales over a given period using card visuals. They will get to plot and interpret data on a line graph.Items IncludedFile folder cover (2 options): if placing all items in a file at a centerSingle large task card (color and blackline) on a sheet outlining the taskTwo small task cards (color and blackline) on a sheet o
Subjects:
Grades:
2nd - 5th
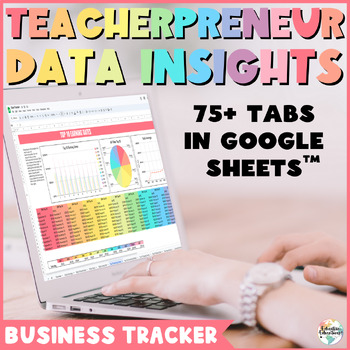
Teacherpreneur Data Insights - TPT Seller Business Tracker Analysis Spreadsheets
Welcome to Teacherpreneur Data Insights – a business data tracker designed to elevate your teacher seller journey. Gain actionable insights, track trends, and optimize your strategies with this comprehensive tool. In a world where data is powerful, this guidebook and Google Sheets combo empowers you to navigate your TPT store effectively. Seamlessly analyze your metrics, make informed decisions, and propel your store to new heights. Utilize this powerful tool to identify your best-selling produc
Subjects:
Grades:
Not Grade Specific
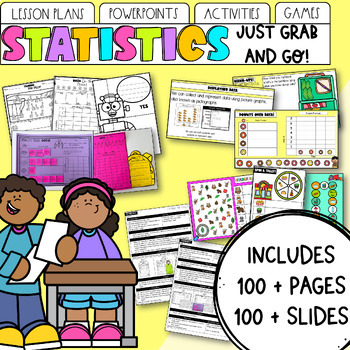
Statistics & Data | Maths Unit: Lessons, PowerPoint, Activities & Games
Looking for statistics and graphing planning that ticks all your boxes? Look no further! Teaching is hard enough, without spending hours creating differentiated lesson plans and activities. Not to mention the time spent planning what your early finishers can do, what assessment points to consider, or sourcing games that consolidate previous skills! With this Statistics and Data Unit, everything is done for you. Want to buy in early to the discounted bundle and get all updates for free? Find my G
Subjects:
Grades:
K - 2nd
Summer School, Camp Activities, PBL | High School Math (AP Statistics)
Spark Student Interest in Real-World Statistics with Scienovate's AP Statistics Project-Based Learning Bundle!Are you an educator, homeschool parent, or high school student looking for engaging ways to apply AP Statistics concepts to real-world challenges? Look no further than Scienovate's Project-Based Learning Projects Bundle for AP Statistics!This comprehensive bundle goes beyond traditional theoretical projects, offering a unique set of Project-Based Learning (PBL) activities specifically de
Subjects:
Grades:
9th - 12th, Higher Education, Adult Education
Summer School, Camp Activities, PBL | High School Math (Statistics)
Spark Curiosity and Ignite Future Scientists with Award-Winning Project-Based Learning (PBL) in Statistics!Are you an educator, homeschool parent, or student looking for engaging, real-world PBL experiences that go beyond the typical "science fair volcano"? Look no further than the Scienovate Science Fair Projects Bundle for High School!This comprehensive bundle throws away the tired, superficial activities and dives headfirst into the powerful application of Statistics in solving critical chall
Subjects:
Grades:
9th - 12th, Higher Education, Adult Education
Math Mammoth Grade 8 Complete Curriculum
Math Mammoth Grade 8 is a complete math curriculum for 8th grade mathematics studies. It contains some typical algebra 1 topics, but not all (based on the Common Core Standards for 8th grade (CCS)). You could classify it as an in-between course between traditional pre-algebra and algebra 1.At the heart of the curriculum are two student worktexts (A and B), each covering about half a year of math work. These worktexts contain all the instruction and the exercises in the same book — which make
Subjects:
Grades:
8th
Also included in: Math Mammoth Grades 5-8 Bundle
Statistics Clipart - SCATTERPLOT GRAPHS
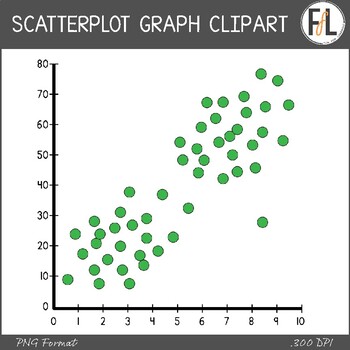
Need some clipart for your secondary grades statistics product? This graphics resource features 7 different scatterplot graphs in a variety of different options that are perfect for making worksheets, interactive notebook elements, interactive whiteboard activities and more! The graphs all come in the following options:2) labeled or unlabeled 3) color, grayscale, or blacklineThe following distribution types are represented by at least one of the graphs:- positive correlation- negative correlat
Subjects:
Grades:
Not Grade Specific
Also included in: Statistics Clipart - Graphs, Secondary Grades - BUNDLE
Statistics and Probability Unit -Math ACT Prep -Lesson Plans, Practice Questions
This unit includes daily suggested lesson plans, bell ringers, activities/ worksheets, review slides, guided notes, ACT-type practice questions, and exit tickets that cover the following topics:Fundamental Counting PrincipleCombinationsPermutationsProbabilityStandard DeviationBivariate Data****************************************This unit is a part of my bundle Math ACT Prep Curriculum 9 week product. The Statistics and Probability unit is covered over 4 days.In addition to the Statistics and P
Subjects:
Grades:
9th - 12th
Types:
Also included in: Math ACT Prep Curriculum BUNDLE - Lesson Plans and Resources
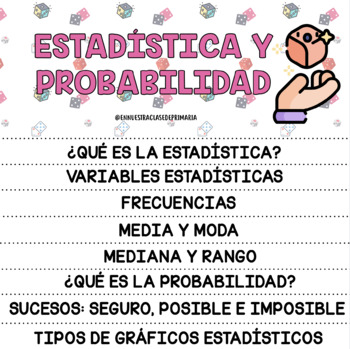
FLIPBOOK ESTADÍSTICA Y PROBABILIDAD
FLIPBOOK para trabajar los siguientes contenidos: ¿Qué es la estadística?Variables estadísticas.Frecuencias,Media y modaMediana y rango¿Qué es la probabilidad?Sucesos: seguro, posible e imposible. Tipos de gráficos.
Subjects:
Grades:
5th - 8th
Roll That Die (Experimental and Theoretical Probability)
This activity is done in pairs. Each person needs a copy of the worksheet and each pair needs one die. If you have felt (used to help reduce noise) hand out one piece to each pair.
The pairs will read the worksheet and complete the activity. They will roll a die and record the results and then compare the experimental probability with the theoretical probability.
When the students have completed the activity, go over the fill-in the blank questions as well as the last three questions.
Subjects:
Grades:
6th - 8th
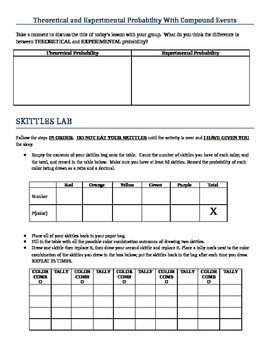
Activity for Theoretical and Experimental Probability of Compound Events
This Skittles Lab is a fun and engaging way to get students excited about finding probabilities. The experiment involves finding the theoretical and experimental probability of choosing a specific order of skittles from a bag. Students work best in groups of three to calculate their probabilities and reflect on their results. This extends what students learned about Single Event Probabilities and now involves a Compound Event. There are step-by-step instructions for students to follow through ou
Subjects:
Grades:
7th
CCSS:
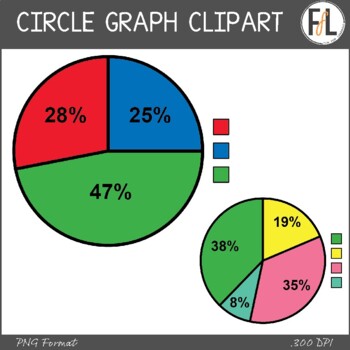
Statistics Clipart - CIRCLE GRAPHS
Need some clipart for your secondary grades statistics product? This graphics resource features 8 different circle graphs (aka: pie charts) in a variety of different options that are perfect for making worksheets, interactive notebook elements, interactive whiteboard activities and more! The graphs all have an unlabeled color key, and come in the following options:2) labeled (with numerical percentages) or unlabeled 3) color, grayscale, or blacklineThese graphs, like ALL my clipart, can be use
Subjects:
Grades:
Not Grade Specific
Also included in: Statistics Clipart - Graphs, Secondary Grades - BUNDLE
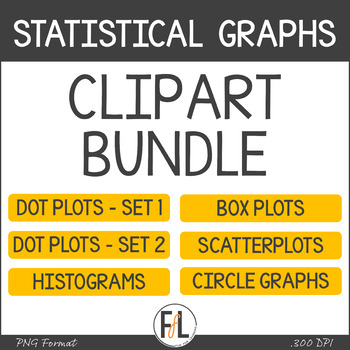
Statistics Clipart - Graphs, Secondary Grades - BUNDLE
Need some graph clipart for your secondary grades statistics product? This clipart bundle includes 5 different clipart sets. You save 30% by buying them together.The graphs in each product come in a variety of options that make them perfect for making worksheets, assessments, interactive notebook activities, and interactive white board files!Options:1) labeled or unlabeled2) color/grayscale/blackline)These graphs, like ALL my clipart, can be used as moveable pieces in digital resources. No ad
Subjects:
Grades:
Not Grade Specific
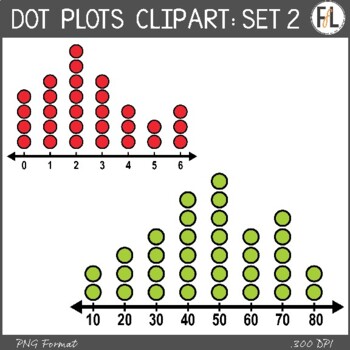
Statistics Clipart - DOT PLOTS, SET 2
Need some MORE clipart for your secondary grades statistics product? This graphics resource features 8 different dot plot graphs in a variety of different options that are perfect for making worksheets, interactive notebook elements, interactive whiteboard activities and more! This second set is designed to be a bit easier than the 1st set. The graphs all come in the following options:2) labeled or unlabeled 3) color, grayscale, or blacklineThe following distribution types are represented by
Subjects:
Grades:
Not Grade Specific
Also included in: Statistics Clipart - Graphs, Secondary Grades - BUNDLE
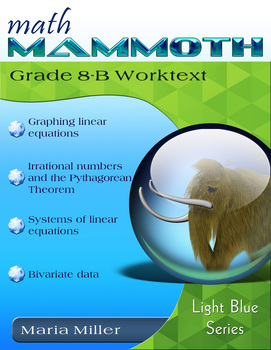
Math Mammoth Grade 8-B Curriculum
Math Mammoth Grade 8-B is a complete math curriculum for the latter half of 8th grade mathematics studies, based on the Common Core Standards for 8th grade (CCS)).At the heart of the curriculum is the student worktext. The worktext contains all the instruction and the exercises in the same book — which makes lesson preparation a breeze. The worktext is written directly to the student, and thus allows many students to teach themselves and to learn directly from the text.You will also get a separa
Subjects:
Grades:
8th - 9th
High School Statistics and Probability Bundle
High School Statistics and Probability PacketThis amazing statistics and probability bundle is all you need for your middle school to High school learners. From calculating averages using frequency tables to condition probability, your learners are definitely going to be immersed in their learning! Buy this high-engagement math bundle today and save hours of lesson planning time.Interactive Digital lessons inside this bundle include:Measures of Central tendencyConditional Probability - Venn Diag
Subjects:
Grades:
7th - 12th
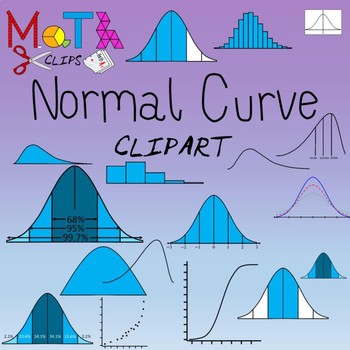
Normal Distribution Statistics Clipart
A collection of 90 images of normal curves (bell curves), labeled subdivided by standard deviation. Includes shaded distributions by standard deviation sections. Also includes examples of other skewed distributions, symmetric distributions, binomial distributions, t-distribution, chi-square. Includes cumulative distribution and probability plots for normal, negatively skewed and positively skewed distributions. Ideal for creating resources for normal distribution and empirical rule concepts
Subjects:
Grades:
Not Grade Specific
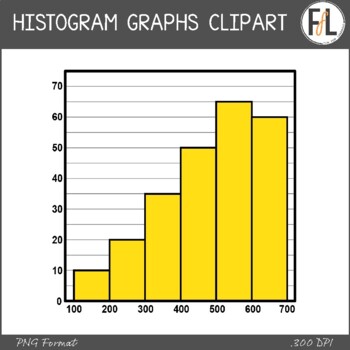
Statistics Clipart - HISTOGRAM GRAPHS
Need some clipart for your secondary grades statistics product? This graphics resource features 8 different histogram graphs in a variety of different options that are perfect for making worksheets, interactive notebook elements, interactive whiteboard activities and more! The graphs all come in the following options:1) labeled or unlabeled2) transparent background or whitefilled 3) color, grayscale, or blacklineThe following distribution types are represented by at least one of the graphs:- p
Subjects:
Grades:
Not Grade Specific
Also included in: Statistics Clipart - Graphs, Secondary Grades - BUNDLE
Statistics Unit 2--Descritpive Statistics
Unit 2: Descriptive StatisticsFrequency DistributionsMeasures of Central TendencyDistribution ShapesWeighted MeanMean of a Frequency DistributionMeasures of VariationThis course is designed for a high school classroom. It's meant to be an informative and fun general statistics course covering:1. Descriptive Statistics2. Study Design3. Probability4. A selection of Inferential Statistics
Subjects:
Grades:
9th - 12th
Food Justice, Food Sovereignty and the Zero Mile Meal; Food & Math
This is one in a continuing series of activities that takes mathematics and applies it to social issue, including Food Waste and Mathematics: From Farm to Table to Dump, Mathematics, Demographics & Slavery: The 1790 Census in Ratio, Percents & Graphs, MathBusters: Percentage Practice to Analyze 2016 Election Results, and Statistics, Histograms and Lies Presidential Candidates Tell. In this case, we are looking at how far food must travel in order to make it from where it is produced to t
Subjects:
Grades:
5th - 12th
Statistics and Probability Complete Unit: 6.SP.1-5
This product is a bundle of all of my products for the 6th-Grade CCSS Statistics and Probability: 6.SP.1-5 Standards! It includes practice sheets, foldables for students' interactive notebooks, posters, a PowerPoint presentation, assessments, and task cards.If you have purchased any of the products below, this is all of them in a bundle, so don't double dip!!! You can also purchase each of the products individually. There is also a simple bundle that includes the practice sheets and foldables
Subjects:
Grades:
5th - 7th
Also included in: Statistics and Probability: CCSS 6.SP.1-5 Bundle
Showing 1-24 of 300 results


