211 results
Statistics research by TpT sellers for TpT sellers
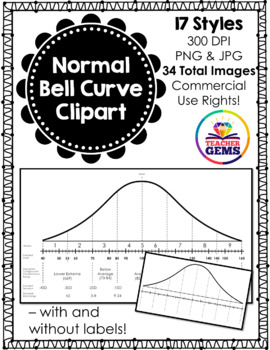
Normal Bell Curve (Normal Distribution) Clipart
Normal Bell Curve (Normal Distribution) Clipart: This Normal Bell Curve (Normal Distribution) clipart set includes 17 distinct styles (6 blank styles and 11 styles with scores) that come in both PNG (transparent) and JPEG (white background) for a total of 34 images. All image files are 300dpi. Commercial use is allowed with proper credit given (see my Terms of Use in the download – or read prior here). Below is a breakdown of all the images included in this product.Normal Bell Curve (NBC) Table
Subjects:
Grades:
Not Grade Specific
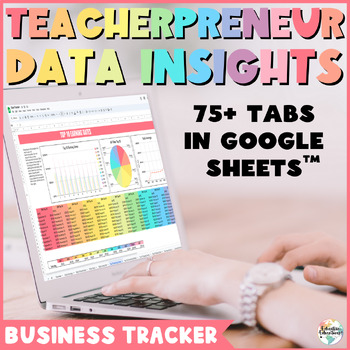
Teacherpreneur Data Insights - TPT Seller Business Tracker Analysis Spreadsheets
Welcome to Teacherpreneur Data Insights – a business data tracker designed to elevate your teacher seller journey. Gain actionable insights, track trends, and optimize your strategies with this comprehensive tool. In a world where data is powerful, this guidebook and Google Sheets combo empowers you to navigate your TPT store effectively. Seamlessly analyze your metrics, make informed decisions, and propel your store to new heights. Utilize this powerful tool to identify your best-selling produc
Subjects:
Grades:
Not Grade Specific
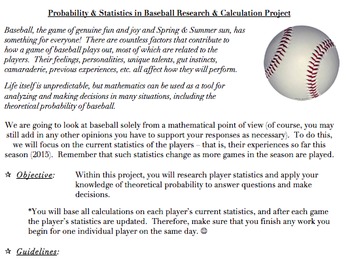
Probability & Statistics in Baseball Project (Common Core Aligned, AND FUN!)
The problems and activities within this document are designed to assist students in achieving the following standards: 6.SP.B.5, 7.SP.C, HSS.CP.A.2, HSS.CP.A.3, HSS.CP.B.7, HSS.CP.B.9, as well as the standards for mathematics practice and the literacy standards. They are also designed to help the teacher assess the students’ abilities when it comes to working with the ideas within the standards.This document contains the following:A project designed to allow students to investigate theoretical
Subjects:
Grades:
5th - 12th, Higher Education, Adult Education, Staff
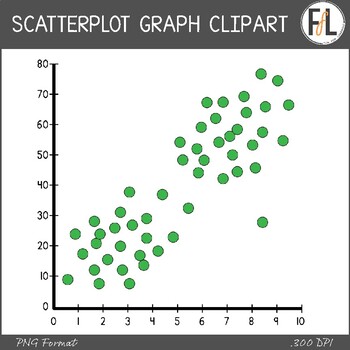
Statistics Clipart - SCATTERPLOT GRAPHS
Need some clipart for your secondary grades statistics product? This graphics resource features 7 different scatterplot graphs in a variety of different options that are perfect for making worksheets, interactive notebook elements, interactive whiteboard activities and more! The graphs all come in the following options:2) labeled or unlabeled 3) color, grayscale, or blacklineThe following distribution types are represented by at least one of the graphs:- positive correlation- negative correlat
Subjects:
Grades:
Not Grade Specific
Also included in: Statistics Clipart - Graphs, Secondary Grades - BUNDLE
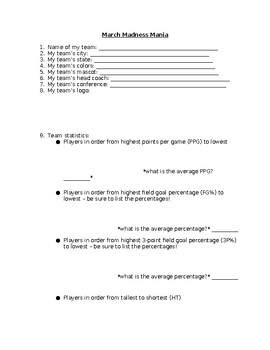
NCAA March Madness Basketball Tournament Team Research Statistics
Do you have students interested in the March Madness basketball tournament? Then this is the activity you need!To begin our March Madness unit, we look at all of the teams participating in the tournament and complete a map together to show where each team is from. We notice that some states have more than others and some states have none, and spend time discussing why that might be. Students will complete their own March Madness bracket.Students will then select a team in the NCAA March Madness
Grades:
4th - 9th
Types:
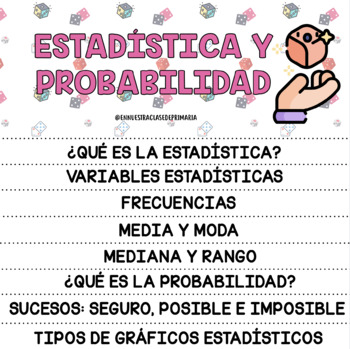
FLIPBOOK ESTADÍSTICA Y PROBABILIDAD
FLIPBOOK para trabajar los siguientes contenidos: ¿Qué es la estadística?Variables estadísticas.Frecuencias,Media y modaMediana y rango¿Qué es la probabilidad?Sucesos: seguro, posible e imposible. Tipos de gráficos.
Subjects:
Grades:
5th - 8th
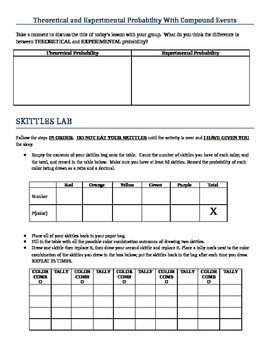
Activity for Theoretical and Experimental Probability of Compound Events
This Skittles Lab is a fun and engaging way to get students excited about finding probabilities. The experiment involves finding the theoretical and experimental probability of choosing a specific order of skittles from a bag. Students work best in groups of three to calculate their probabilities and reflect on their results. This extends what students learned about Single Event Probabilities and now involves a Compound Event. There are step-by-step instructions for students to follow through ou
Subjects:
Grades:
7th
CCSS:
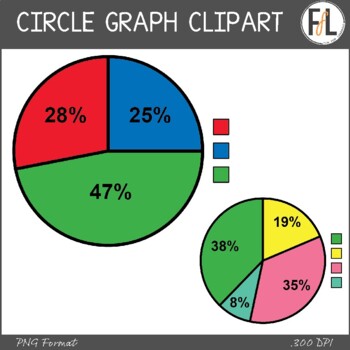
Statistics Clipart - CIRCLE GRAPHS
Need some clipart for your secondary grades statistics product? This graphics resource features 8 different circle graphs (aka: pie charts) in a variety of different options that are perfect for making worksheets, interactive notebook elements, interactive whiteboard activities and more! The graphs all have an unlabeled color key, and come in the following options:2) labeled (with numerical percentages) or unlabeled 3) color, grayscale, or blacklineThese graphs, like ALL my clipart, can be use
Subjects:
Grades:
Not Grade Specific
Also included in: Statistics Clipart - Graphs, Secondary Grades - BUNDLE
Statistics Clipart - Graphs, Secondary Grades - BUNDLE
Need some graph clipart for your secondary grades statistics product? This clipart bundle includes 5 different clipart sets. You save 30% by buying them together.The graphs in each product come in a variety of options that make them perfect for making worksheets, assessments, interactive notebook activities, and interactive white board files!Options:1) labeled or unlabeled2) color/grayscale/blackline)These graphs, like ALL my clipart, can be used as moveable pieces in digital resources. No ad
Subjects:
Grades:
Not Grade Specific
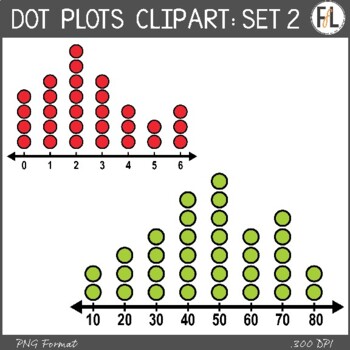
Statistics Clipart - DOT PLOTS, SET 2
Need some MORE clipart for your secondary grades statistics product? This graphics resource features 8 different dot plot graphs in a variety of different options that are perfect for making worksheets, interactive notebook elements, interactive whiteboard activities and more! This second set is designed to be a bit easier than the 1st set. The graphs all come in the following options:2) labeled or unlabeled 3) color, grayscale, or blacklineThe following distribution types are represented by
Subjects:
Grades:
Not Grade Specific
Also included in: Statistics Clipart - Graphs, Secondary Grades - BUNDLE

Scatter Plot and Bivariate Data Research Project
Students will begin a statistics project on one of their favorite restaurants or food chains! They will be researching nutrition facts and surveying others on what types of food they like to eat there. Through this data collection they will work on their skills of creating scatter plot graphs, creating relative frequency tables, and analyzing this data. This can be used either by paper or digitally. I used it the last two years during distance learning. Rubric included.
Subjects:
Grades:
7th - 12th
Types:
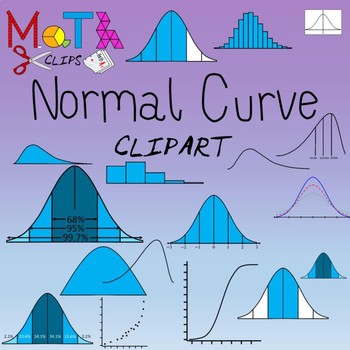
Normal Distribution Statistics Clipart
A collection of 90 images of normal curves (bell curves), labeled subdivided by standard deviation. Includes shaded distributions by standard deviation sections. Also includes examples of other skewed distributions, symmetric distributions, binomial distributions, t-distribution, chi-square. Includes cumulative distribution and probability plots for normal, negatively skewed and positively skewed distributions. Ideal for creating resources for normal distribution and empirical rule concepts
Subjects:
Grades:
Not Grade Specific
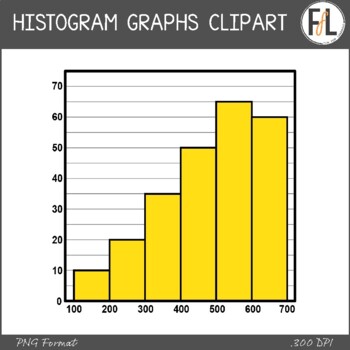
Statistics Clipart - HISTOGRAM GRAPHS
Need some clipart for your secondary grades statistics product? This graphics resource features 8 different histogram graphs in a variety of different options that are perfect for making worksheets, interactive notebook elements, interactive whiteboard activities and more! The graphs all come in the following options:1) labeled or unlabeled2) transparent background or whitefilled 3) color, grayscale, or blacklineThe following distribution types are represented by at least one of the graphs:- p
Subjects:
Grades:
Not Grade Specific
Also included in: Statistics Clipart - Graphs, Secondary Grades - BUNDLE
IM Grade 6 MathTM Guided Math Notes and Teacher Version
Here are all the notes needed for 6th grade math. This product included the student and teach version of the notes. This resource is based on the IM K-12 MathTM authored by Illustrative Mathematics® and offered under a CC BY 4.0 License.
Subjects:
Grades:
6th
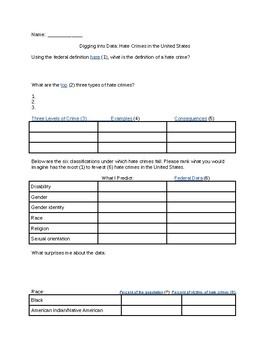
The 57 Bus- Looking at Hate Crime Data
A guided web search on hate crime data from the FBI, CDC, Pew Research Center, and U.S. Census Bureau. Uses reflection questions to make conclusions and predictions about the distribution of hate crimes. The kids are fascinated by the data!
Subjects:
Grades:
7th - 12th, Higher Education, Adult Education
Types:
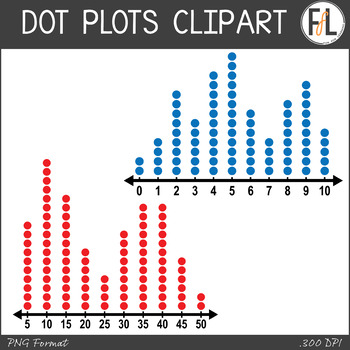
Statistics Clipart - DOT PLOTS, SET 1
Need some clipart for your secondary grades statistics product? This graphics resource features 8 different dot plot graphs in a variety of different options that are perfect for making worksheets, interactive notebook elements, interactive whiteboard activities and more! The graphs all come in the following options:2) labeled or unlabeled 3) color, grayscale, or blacklineThe following distribution types are represented by at least one of the graphs:- positive distribution- negative distributi
Subjects:
Grades:
Not Grade Specific
Also included in: Statistics Clipart - Graphs, Secondary Grades - BUNDLE
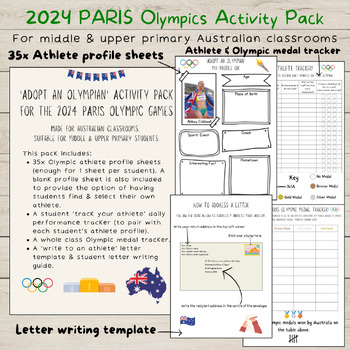
2024 PARIS Olympic Games Activity Pack | Middle & Upper Primary | Australia
Are you an Australian Teacher who is looking for a fun & engaging way to connect your students to the 2024 PARIS Olympic Games? This is the PERFECT resource for you! This activity pack provides students with the opportunity to:Research & profile an Australian Olympic athlete who has been selected to compete at the 2024 Paris Olympic Games.Individually track their athlete over the 19 days of the Olympic Games.Write a personal letter of support to their athlete, to be posted to them at the
Subjects:
Grades:
3rd - 6th
Types:
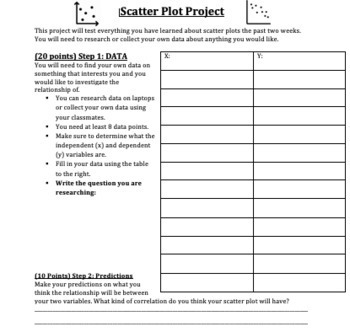
Scatter Plot Project
This is an awesome research project that is summative assessment for a Scatter Plot unit. For this project students are asked to pick a research question about bivariate data, gather the data online or through a survey. Next, they will make a prediction, construct a scatter plot, draw a line of best fit, find the equation of a line of best fit, and answer analytical questions about the data by interpreting the scatter plot. This is a great project that will allow students to utilize technology t
Subjects:
Grades:
7th - 10th
Types:
Careers in Statistics Digital Project
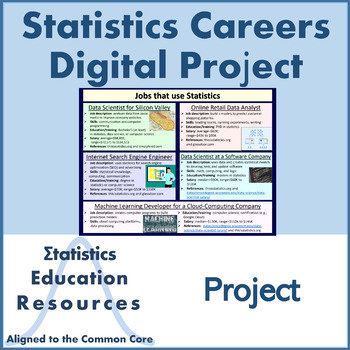
Distance Learning: Careers in Statistics Project Students complete this project by researching careers in statistics and creating a digital report. They select five careers and summarize their characteristics including job description, required skills (such as how statistics are used), education/training, and salary. Students may elect to create a digital poster (EDITABLE 24-inch by 18-inch template in PPTX included) or a short video report. Only want to assign a digital poster or only want vid
Subjects:
Grades:
9th - 12th
Types:
Also included in: Bundle: Algebra I Statistics Activities (Common Core Aligned)

Statistics Research Project
This project can be done in an Algebra 1 class or in a beginning Statistics class.Through this project students will...- Create a two-question survey questionnaire (using Google Forms).- Conduct a survey that will produce quantitative data.- Interpret survey data, and use Desmos to generate the line of best fit.- Find the correlation coefficient and use these values determine how well the line of best fit models the data.- Generate a residual plot and use it to interpret data.- Find the sum of t
Subjects:
Grades:
8th - 12th
Also included in: Math in the Real World Projects Bundle
Sequences and Series Worksheets Algebra 2
Series WorksheetsThis is a graphical preview of the Sequences and Series Worksheets. You can customize these worksheets by selecting various variables to meet your specific needs. Each worksheet is randomly generated, ensuring an endless supply of unique and high-quality materials for classroom or home use. Our collection includes general sequences, arithmetic sequences, geometric sequences, comparisons of arithmetic and geometric sequences, general series, arithmetic series, arithmetic and geom
Subjects:
Grades:
8th - 12th
College Research Project Unit
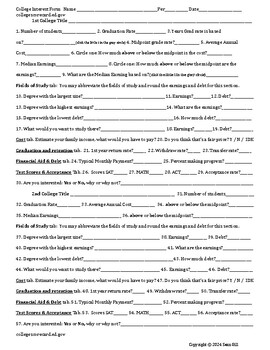
This is an excellent unit on college research. If your school is college focused or you just need a interested based project to get the students engaged, this is a great way to get kids interested in colleges and their stats. Did you know that the federal government compiles all the FAFSA data? It keeps track of how much money each person who filled out a FAFSA makes over the long term (10 years+). There is a wealth of data on every college that has ever accepted federal funding and it is all at
Subjects:
Grades:
6th - 12th
Types:
Global Crisis Project (Exponential Functions)
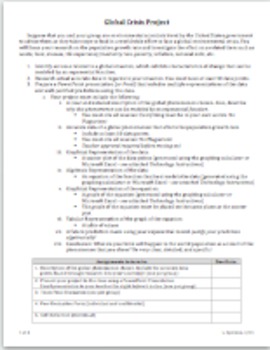
The goal of the Global Crisis Project is to have students see and understand real applications for exponential functions. Students will do research on the population growth rate (globally or they may choose a specific location) and investigate the effect that a related global issue such as waste, food, disease, life"expectancy/mortality rate, poverty, inflation, national debt, etc. has on population. Students find accurate data points from reliable internet sources, and will use exponential reg
Subjects:
Grades:
9th - 12th
Also included in: Math in the Real World Projects Bundle
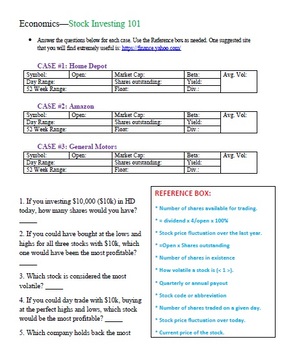
Stock Investing 101
For high school (and savvy middle school) economics students, Stock Investing 101 is a great tool for students to explore stocks on the Stock Market. This worksheet can be easily edited by simply changing the companies that the students need to investigate in order for it to be used over and over again. Estimated time for student completion: 45-60 minutes
Subjects:
Grades:
7th - 12th
Types:
Showing 1-24 of 211 results


