95 results
Graphing microsofts for staff
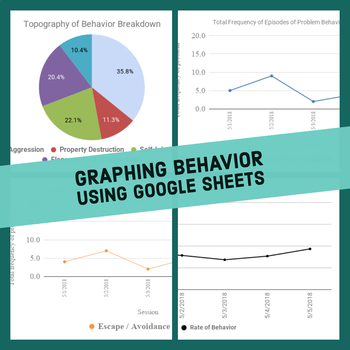
ABA Behavior Graph Excel Workbook
You do not need to purchase multiple licenses; feel free to use with as many clients as you want.Note: Email me at ian.vignes@atlasautismcenter.com for a link to the google sheets version, once you've made your purchase.Description: This file graphs behavior data for a single client. In it's current format, it records frequency and rate of behavior, as well as frequency of function of behavior. In addition, there is a pie chart breakdown of the percentage of each topography of behavior. For an
Grades:
Staff
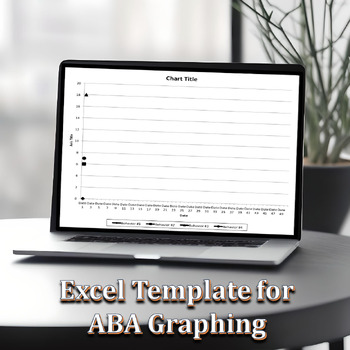
Excel Graphing Template for ABA
Use this Excel template to create a line graph in proper ABA format for behavioral data. An example of a graph is provided in this template. You may graph up to 4 behaviors at a time. To use: 1. Open the Excel file2. Fill in the 4 behaviors you would like to graph at the top (to replace Beh #1, Beh #2, etc)3. Fill in the dates you have data for (this graph is designed to hold 50 days worth of data)4. Fill in your behavioral data in the columns for each behavior5. Watch your graph change as you t
Subjects:
Grades:
Staff

Jr. Zoo Keepers~Supplemental Activities for Young Learners
Either before or after traveling on your Zoo Field Trip this year, complete the activities in this Jr. Zoo Keeper Unit! You and your young learners will just love participating in the hands-on, engaging, and exploratory activities included. There are opportunities to practice math (graphing, surveying), ELA (making words, journal prompts) and social skills (job application.) Topics throughout the unit focus on being a Zoo Keeper, Animals, and the Zoo. At the completion of all the activities,
Subjects:
Grades:
1st - 3rd, Staff
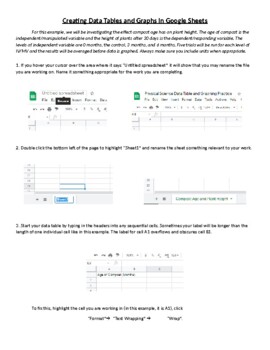
Creating Data Tables and Graphs in Google Sheets
This is an activity that walks students through the process of organizing and entering data into a data table and then using that data to generate line, bar, and pie charts. Once the graphs are generated, the process of formatting and editing the different parts of each graph is explained.

Rio Olympics 2016 Medal Tally
This is designed to engage and excited students in the Rio Olympics for 2016, use this medal tally to track your country or other countries medal count.
Grades:
PreK - 12th, Higher Education, Adult Education, Staff
Types:
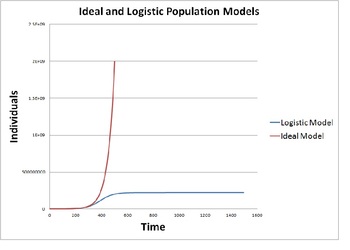
Modeling Population Growth (Ideal vs. Logistic Model)
This activity provides instructions to construct a mathematical model on a blank spreadsheet that simulates population growth using an ideal model and a logistic model. The activity provides background discussion and then gives instructions on how to program a spreadsheet to produce and display the ideal and logistic population models. Their results are studied for various cases including human population, rabbits, polar bears, bacterial and yeast colonies.
This quantitative population model
Subjects:
Grades:
9th - 12th, Staff
Types:

History of Health Care - My Timeline
Critical Thinking with application of Math using graphics is all in this lesson! Learning how to create a medical timeline is essential for healthcare in today's world. Designing a timeline for the history of healthcare is described in this lesson, however this lesson is designed to allow students to create their own (with parent permission) or to create a "mock design" of a medical timeline may work better for classroom use. This will show the "new" way of presenting medical history to your p
Grades:
9th - 12th, Higher Education, Adult Education, Staff
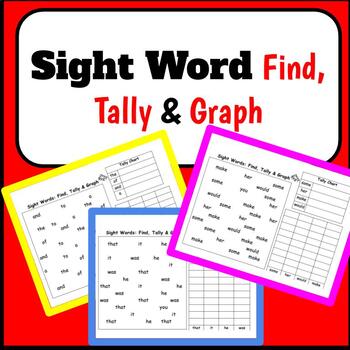
K-2 FRY Words Pack: Find-Tally-Graph for first 100 words
This is a packet of Fry sight words. It includes the first 100 and then some second 100 words. There are 4 words to practice on each page. Students have to find all of the words, tally how many of each word they found, and graph how many of each word. This allows for students to see the new sight words multiple times and it helps them learn the words. This packet correlates with my other pack of sight words that I created. This can be used for word work, morning work, or homework.
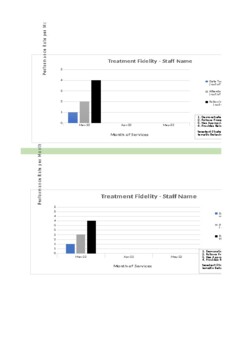
Fidelity Check with Graphs (Short)
Keep track of staff and treatment fidelity without distractions with this (weekly/monthly) checklist. Graphing is automatic and will generate based on the formula. Fully customizable to your companies specific goals and needs.
Subjects:
Grades:
Staff
Types:

Data Representation Powerpoint
The presentation contains: 1) TALLY MARKS Learning Objectives. Definition of a tally mark. Uses of tally mark. How to count a tally mark. Tally Mark Chart. Construction of a tally mark table with an example. Application on real life problems on tally mark. Read and Interpret a tally mark table.The presentation contains: 2) FREQUENCY DISTRIBUTION TABLEDefinition of a Frequency Distribution Table. Types of Frequency Distribution Table: a) Discrete Frequency Distribution Table (Ungrouped).b) C
Subjects:
Grades:
1st - 10th, Higher Education, Staff

6 Editable Bar Graph Templates 2.0
Finally a simple and professional graph space that students can fill out without any design issues getting in the way. This file contains 6 ready-to-use graph options. Print them and have students fill them with pencil and ruler, or distribute them over computer and let them practice entering the data. Get a project perfect finish every time. Maybe you just want to fill it out live on a projector? The possibilities are endless! It's okay to say you love these bar graphs. So do we.Contains:- 2 bl
The Basics of Algebra Theory: From Variables to Graphing in Power Point
Feeling a bit OVERWHELMED and Need to Teach ALGEBRA THEORY? Then here is a power point presentation to present to your students while feeling confident in your skills. Each slide will present my style for teaching the basics of Algebra theory with my actual lecture presentations. Topics covered in this presentation are:What is a variable?Basic terminology.Evaluating an open sentence using a replacement set.Order of operation (PEMDAS).Operating on signed numbers.Combining similar terms.Solving
Grades:
4th - 12th, Adult Education, Staff

Pie Chart Powerpoint
The presentation contains:Learning Objectives.Definition of a Pie Chart.Tips for construction of pie chart.Steps to construct a pie chart with an example.Scaling and drawing a pie chart.Read and Interpret a pie chart.
Subjects:
Grades:
5th - 10th, Staff
Also included in: Data Representation Powerpoint

Graphing and Data Analysis
Types of data, graphing, choosing suitable graphs according to the data available and analysis of said graphs and data is an essential skill in Science and Maths based subjects. Yet it is rarely taught explicitly due to time constraints and other factors. The PowerPoint (PPT) and a printer friendly PDF version has been included for your convenience. This interactive PowerPoint includes student and teacher notes on the following:Types of graphsTypes of dataQualitative and Quantitative DataGraphs
Grades:
7th - 12th, Staff
Also included in: Science Skills Bundle
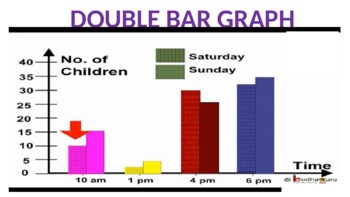
Double Bar Graph Powerpoint
The presentation contains:Learning Objectives.Definition of a double bar graph.Parts of a double bar graph.Difference between bar graph and double bar graph.Tips for construction of double bar graph.Steps to construct double bar graph with an example.To read and interpret the double bar graph.
Subjects:
Grades:
5th - 10th, Staff
Also included in: Data Representation Powerpoint

Introduction to Data Visualization
This presentation introduces key concepts and considerations in data visualization, including:the history of data visualizationan introduction to the benefits and importance of data visualization types of visualizationshow to choose a visualization typedata visualization design principles and best practicesleading data visualization platforms the differences between raster and vector graphicskey considerations when thinking about creating a visualization Use this as part of a unit on graphing, d
Subjects:
Grades:
6th - 12th, Higher Education, Adult Education, Staff
Also included in: Graphic Design Growing Bundle
Line Graph Powerpoint
The presentation contains:Learning objectives.Definition of a line graph.Parts of a line graph.Tips for construction of line graph.Steps to construct line graph with an example.Reading and Interpreting a line graph.Advantage of line graph.
Subjects:
Grades:
5th - 10th, Staff
Also included in: Data Representation Powerpoint
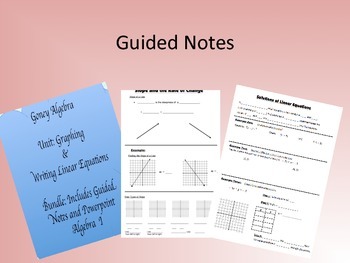
Algebra Linear Equations Guided Notes Homework, and PowerPoint Bundle
This is a bundle of guided notebook pages for the interactive math notebook on all of the Linear Equations Concepts (Ch 5 in Algebra 1, Pearson).Included is a matching Powerpoint that follows the notes exactly. Included: Homework for each lesson and Test review. Interactive Math Notebook pages included in bundle are:Graphing Linear EquationsParallel and Perpendicular LinesPoint-slope FormSlope-intercept FormStandard FormSlope and Rate of ChangeSlope FormulaWriting Equations from a GraphWriting
Grades:
8th - 12th, Adult Education, Staff

Transformations Word Search
Transformations Word Search
23 words to find about Transformations
You may also be interested in my other top-selling products:
EQUIVALENT FRACTIONS (33 Items)
Fractions 10 Pages of Practice (191 questions)
Fractions Review and Reinforcement
Fractions Test (15 Q)
4th Grade Word Problems Quiz (10 Q)
Equations and Inequalities Quiz (20 Questions)
Evaluate Expressions Quiz (22 questions)
Pairs of Lines Quiz (17Q)
Decimals, Fractions and Percents Quiz (10 Q)
Order of Operations Quiz
Grades:
3rd - 12th, Higher Education, Adult Education, Staff
Types:
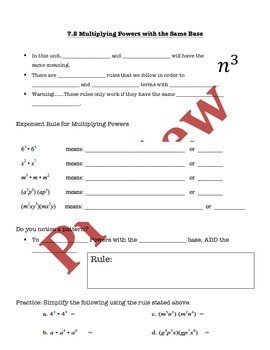
Multiplying Powers with Same Bases Guided Notes, PP, Homework
Multiplying Powers with the Same Bases(Ch 7 in Algebra 1, Pearson).
I Included: Homework for each lesson, Guided Notes with Matching Powerpoint
You can also buy this as a unit in a bundle. The Interactive Math Notebook pages included in bundle are:
Zero and Negative Exponents
Multiplying Powers with the Same Bases
More Multiplication (Powers to Powers)
Division Properties of Exponents
Rational Exponents and Radicals
Exponential Exponents
Scientific Notation.
Grades:
7th - 12th, Higher Education, Adult Education, Staff
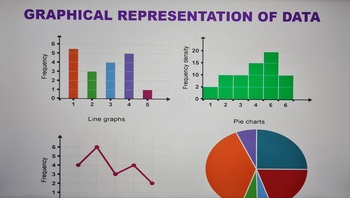
Graphical Representation of Data Powerpoint
The presentation contains the follows:1) BAR GRAPH Learning objectives. Definition of a bar graph. Parts of a bar graph. Tips for construction of bar graph. Steps to construct bar graph with an example. Types of bar graph. Advantages of bar graph. 2) DOUBLE BAR GRAPH Learning Objectives. Definition of a double bar graph. Parts of a double bar graph. Difference between bar graph and double bar graph. Tips for construction of double bar graph. Steps to construct double bar graph wit
Subjects:
Grades:
5th - 9th, Staff
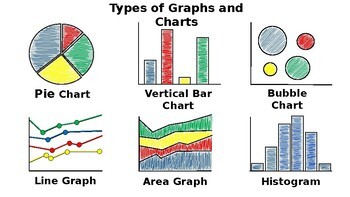
Types of Graphs and Charts - Science Journal Illustration
This is a step by step illustration of each of the 12 types graphs and charts that can be created using Microsoft Excel/Google Sheets. This can be used as an introduction to any Microsoft Excel/Google Sheets Graph and Charts lesson plan. Students use 2 pieces of blank paper and colored pencils to build background knowledge of the types of graphs and charts able to be utilized by entering data on an Excel/Google Spreadsheet and transforming the data into visual representations.
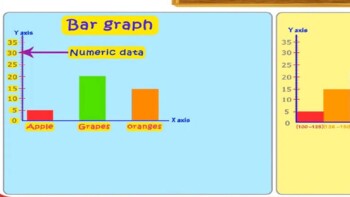
Bar Graph Powerpoint
The presentation contains:Learning objectives.Definition of a bar graph.Parts of a bar graph.Tips for construction of bar graph.Steps to construct bar graph with an example.Types of bar graph.Advantages of bar graph.
Subjects:
Grades:
6th - 9th, Higher Education, Staff
Also included in: Data Representation Powerpoint
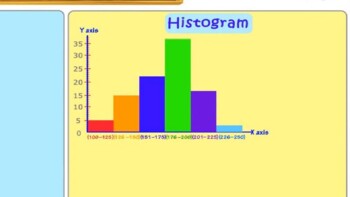
Histogram Powerpoint
The presentation contains:Learning Objectives.Definition of a Histogram.Parts of a histogram.Difference Between bar graph and histogram.Types of intervals.Tips for construction of bar graph.Steps to construct bar graph with an example.Read and Interpret a histogram.
Subjects:
Grades:
7th - 11th, Staff
Also included in: Data Representation Powerpoint
Showing 1-24 of 95 results


