20 results
Graphing resources for Google Apps and for staff
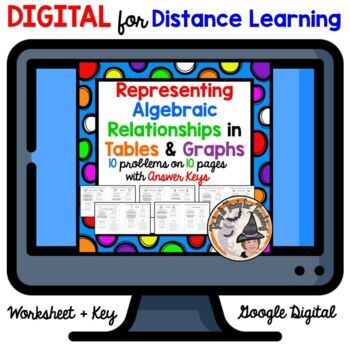
DIGITAL Representing Algebraic Relationships in Tables and Graphs Equations KEY
Math Teachers ~ This is EVERYTHING you need to teach Creating a Table and Graph and Writing an Equation. DIGITAL-10 pages with 10 different word problem scenarios. In the Zipfile "Representing-Algebraic-Relationships-in-Tables-and-Graphs-Equations" you get: DIGITAL-for Distance Learning Google-Slides, a PDF of 10 page worksheet, PDF of the 10 page Answer KEY plus Smartboard Slides AND Powerpoint Slides with 20 pages so you can teach from slides for a guided lesson, and go over Answer Key. Easily
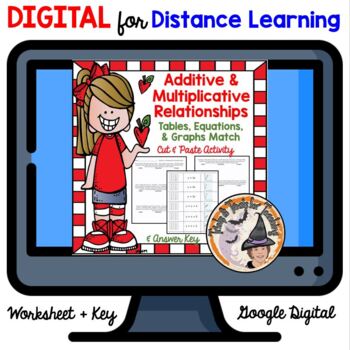
DIGITAL Additive Multiplicative Relationships Activity Equations Tables Graphs
Math Teachers ~ You'll LOVE this FABULOUS, DIGITAL-Math for Distance Learning Additive-and-Multiplicative-Relationships Cut-and-Paste, Matching Equations-Tables-and-Graphs Activity. Answer KEY included. Your students will LOVE this and you'll want to use it year after year. You get Google Slides with cut/paste pieces ready to move around PLUS Powerpoint, PDF versions of worksheet and Answer KEY. EVERYTHING you need for a terrific Math Activity either FACE to FACE students in math centers or stat
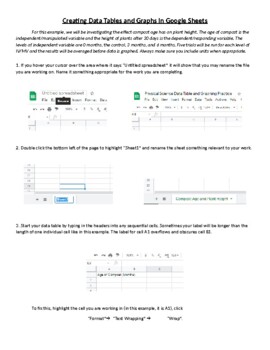
Creating Data Tables and Graphs in Google Sheets
This is an activity that walks students through the process of organizing and entering data into a data table and then using that data to generate line, bar, and pie charts. Once the graphs are generated, the process of formatting and editing the different parts of each graph is explained.
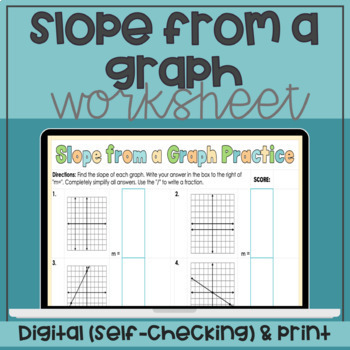
Slope from a Graph PDF & Digital Self-Checking Worksheet
In this practice, students will work to find the slope of a linear equation from a graph. This product includes a PDF worksheet or a digital self-checking google sheets version. In the self-checking version, students answer questions correct and are instantly get verification if their answer is correct or if they need to try again. After they answer all questions, they are given a score based on their answers.Included:PDF WorksheetGoogle Sheets Self-Checking WorksheetAnswer KeyWho should purchas
Grades:
7th - 9th, Staff
Types:
CCSS:
Also included in: Algebra 1 Linear Equations Bundle
6th-Common Core Number System- (PartB) Editable, Interactive, & Instant Feedback
There are hundreds of Math In A Snap worksheets created. This video will give you examples of some of the worksheets created and how you can edit and create your own problems. The video will also show you how students will interact with the worksheets and receive instant feed back.https://youtu.be/LNZLgu2Pg2c Use problems already created or create your own problems that will give your students instant feedback after each question. You can duplicate any assignment to create different levels of di
Subjects:
Grades:
6th, Staff
Types:
Normal Distribution Curve with Google Sheets —Distance Learning
In this lesson, you will learn how to create a normal distribution curve with Google Sheets. A normal distribution curve is a Bell curve. Here are some of the things you will learn.query the data into a new sheetsort and filter the dataUse Named Rangesuse AVERAGE, MEDIAN, MODE, and STANDARD DEVIATION functionsUse the Frequency distribution function for the Histogram chartUse the Normal Distribution functionGraph the normal distributioncompare the normal distribution to the histogram
Subjects:
Grades:
3rd - 12th, Higher Education, Adult Education, Staff
Types:
Google Sheets Bar Charts (Distance Learning)
Create bar charts using Google Sheets. Learn how to format the bar charts to represent information and trends. Create stacked and horizontal bar charts. Get a copy of the data in the lessons so you can follow along. Learn to publish charts using Docs, Slides, Sheets, or Sites.
Subjects:
Grades:
2nd - 12th, Higher Education, Adult Education, Staff
Types:
CCSS:
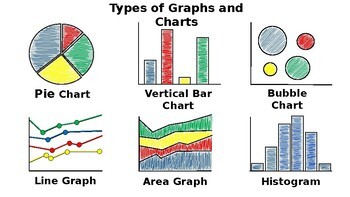
Types of Graphs and Charts - Science Journal Illustration
This is a step by step illustration of each of the 12 types graphs and charts that can be created using Microsoft Excel/Google Sheets. This can be used as an introduction to any Microsoft Excel/Google Sheets Graph and Charts lesson plan. Students use 2 pieces of blank paper and colored pencils to build background knowledge of the types of graphs and charts able to be utilized by entering data on an Excel/Google Spreadsheet and transforming the data into visual representations.
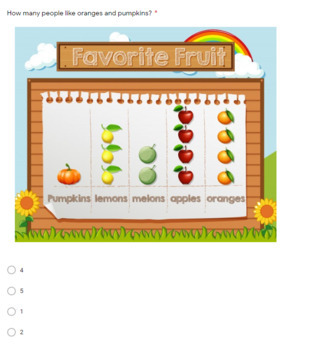
Favorite Fruit Pictograph Google Form Quiz
There are thirteen questions about a pictograph. What is the title of this graph?How many people like pumpkin?How many people like lemons?How many people like melons?How many people like apples?How many people like oranges?How many people like oranges and pumpkins?How many people like lemons and melons?How many people like apples and oranges?How many more people like apples than melons?How many more people like oranges than pumpkin?How many more people like lemons than melons?Which fruit is the
Grades:
PreK - 12th, Staff
Types:

Carnegie Learning Algebra 1 Anchor Charts
These anchor charts are digital to put in your online platform for students to use at home. This is in the order of the Carnegie Learning book for Algebra 1, but can be adapted for your curriculum to reorganize.
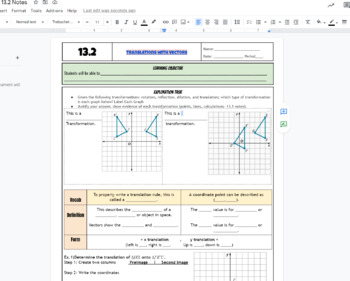
Transformations: Translations & Vectors Graphing Fillable Notes & KEY
Translations with vectors(13.2). Starts off with an exploration task for students to try on their own from the previous notes on (13.1) Reflections (Transformations). Students work to create a rule for each translation by either counting the points from the graph or by calculating the difference between the x and y values of the new and original vertices. This is scaffolded and KEY is included. Highlighted in red on top click for PDF of the key. Editable to your liking of fonts and so forth on g
Grades:
7th - 12th, Higher Education, Adult Education, Staff
CCSS:

Transparent Grid System For Coordinate Mapping
This is a .png grid system that can be overlaid on top of any image to assist teachers and students as they explore grid systems and coordinate mapping.
Grades:
PreK - 12th, Higher Education, Adult Education, Staff
Types:
Histogram charts with Google Sheets - Distance learning
Google Sheets has a histogram chart tool. To use it you need to know what the information in a histogram represents. The charts need to be fine-tuned to accurately represent the data. In the lesson, we walk to the data and how it needs to be represented in a histogram. You will learn how to fine-tune the chart settings to it accurately represents the data. The lesson includes a preview of the final product. You have access to the working document so you can follow the lesson.
Subjects:
Grades:
4th - 12th, Higher Education, Adult Education, Staff
Types:
Custom 3D Bar Charts with Google Drawings - Distance learning
In this lesson, we leverage the graphic tools in Google Drawings to create custom 3D bar charts. The whole process is manually done. It provides students a fundamental understanding of how charts are created in spreadsheet tools. We begin with a 3D bar chart. We then transform that bar chart to one represented by 3D cylinders and arrows. The lesson includes a preview of the final product. The lesson also includes a template to help you follow along in the lesson. Use the preview file to see a pr
Subjects:
Grades:
4th - 12th, Higher Education, Adult Education, Staff
Graph linear and quadratic equations with Google Sheets (Distance Learning)
In these lessons, you will learn how to graph linear and quadratic equations. Create formulas using Google's powerful math tools. Graph linear and quadratic equations using charts. Manipulate the values to demonstrate how to solve a variety of problems. Very good as a teaching tool for the introduction to linear and quadratic equations.
Subjects:
Grades:
4th - 12th, Higher Education, Adult Education, Staff
Types:
Comparison Line Charts with Google Sheets —Distance Learning
Create line charts that compare data. In the lesson, we use data from NOAA on earthquakes. We compare earthquakes across two decades. These charts are good for compare and contract activities.
Subjects:
Grades:
3rd - 12th, Higher Education, Adult Education, Staff
Types:
DIGITAL - Distance Learning - Question of the Day - Google SLIDES
A simple and engaging way to engage with students digitally!Educators can pose a question of the day and share the SLIDE deck with students. Students can click and drag their photo/shape/initials/etc. to record their vote!
Subjects:
Grades:
PreK - 3rd, Staff
Types:
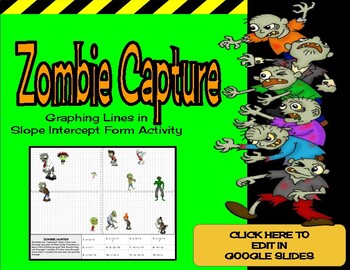
Zombie Capture: Graphing Lines in Slope Intercept Form Activity
Working on y=mx+b equations but want to mix it up for your students? This worksheet is what you are looking for. This zombies themed activity has your students graphing linear equations in a fun and engaging way. The students are provided 12 different y=mx+b equations and 12 different zombies. Students will cut out each equation and graph the line on the zombie graph. They will then glue the equation next to the zombie that it captures.Zombies are captured when a line runs through any part of th
Grades:
7th - 10th, Higher Education, Adult Education, Staff
Types:

Using Google Sheets to Chart/Graph data from solarsystemscope.com
Students follow step by step instructions using a Google Slides Presentation to create a chart/graph using Google Sheets and data from solarsystemscope.com
Subjects:
Grades:
6th - 12th, Higher Education, Adult Education, Staff
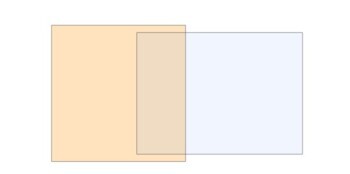
Editable Venn Diagrams - Square - for Sets and Subsets
You are free to arrange and adapt these editable Venn diagrams accordingly with your teaching objectives. You can add text box, images or print them as blank copies and use them in your class.Venn Diagrams are the perfect tools to learn relationships between Sets / Subsets and Logical - Mathematical Activities as Unions, Exclusions, Intersections.Venn Diagrams may be used in almost any teaching domain as a tool to analyze, compare, describe and classify things. They are an useful tool for proble
Subjects:
Grades:
K - 12th, Higher Education, Adult Education, Staff
Showing 1-20 of 20 results


