1 result
Graphing resources for Microsoft OneDrive and for staff

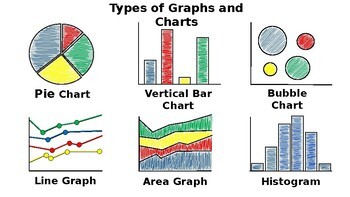
Types of Graphs and Charts - Science Journal Illustration
This is a step by step illustration of each of the 12 types graphs and charts that can be created using Microsoft Excel/Google Sheets. This can be used as an introduction to any Microsoft Excel/Google Sheets Graph and Charts lesson plan. Students use 2 pieces of blank paper and colored pencils to build background knowledge of the types of graphs and charts able to be utilized by entering data on an Excel/Google Spreadsheet and transforming the data into visual representations.
Showing 1-1 of 1 results


