420 results
Graphing classroom forms for Microsoft OneDrive
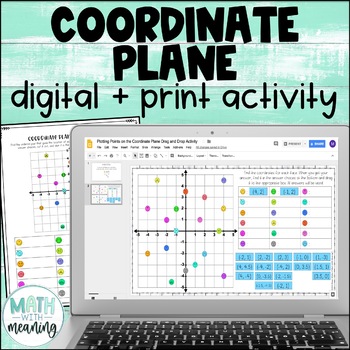
Coordinate Plane Activity - Digital and Print - Plotting Points 4 Quadrants
Looking for a fun way for students to practice using the coordinate plane? Students will practice writing ordered pairs for points on the coordinate plane with this no-prep digital activity! Students will find the ordered pairs for 18 colorful emoji faces on the coordinate plane.The ordered pairs do include decimals (halves only). Please view the preview file to make sure that this activity is appropriate for your students. This product includes the following:A link to the digital activity on Go
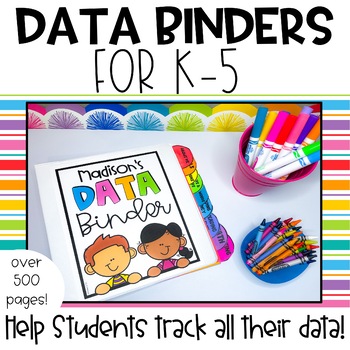
K-5 Student Data Tracking Binders
Seeing students track their own data is amazing. Data tracking binders can help to keep data organized all year long! Track assessments, grades, growth, writing samples, and so much more! Data binders truly help students take ownership of their own learning, and it gets students excited to see the growth that they have made throughout the year! Use these student data binders to have your students track their own data in a kid-friendly way! These binders include over 500 pages to support K-5 stud
Subjects:
Grades:
K - 5th
Also included in: Back to School Resource Bundle | First Week of School
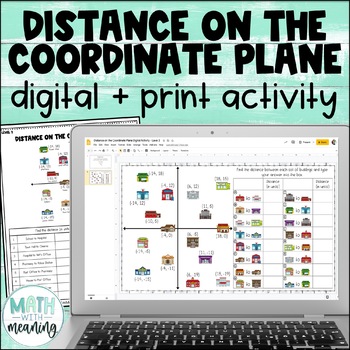
Distance on the Coordinate Plane Digital and Print Activity
Looking for an engaging, no-prep activity to practice finding distance between points on the coordinate plane? Students will find the distance between sets of buildings on a town map with this fun digital and print activity.There are 3 different levels of this activity included:Level 1: Points are shown on a coordinate plane with grid lines and axes go from -5 to 5Level 2: Points are shown on a coordinate plane with no grid lines and axes go from -20 to 20Level 3: Points are not shown on the coo
Subjects:
Grades:
5th - 8th
CCSS:
Also included in: Middle School Math Digital and Print Activity Bundle Volume 3
Graph Paper: Full Page Grid - half inch squares - 14x19 boxes - no name line
Graph Paper: Full Page Grid - half inch squares - 14x19 boxes - no name line - King Virtue's Classroom
Never run out of graph paper again! Use this item to print grid paper for math, science, and other classroom activities.
This set includes:
1 graph paper page
Enjoy!
:)
Copyright © King Virtue’s Classroom • www.kingvirtuesclassroom.com • All rights reserved.
Subjects:
Grades:
Not Grade Specific
Types:

Exponential Functions Introduction Activity in Digital and Printable
Engage students with this intro lesson that will get them thinking exponentially.Included in download:Would you rather? Choices to get students thinking (PDF and Google Forms Poll included)Table and Graph for students to explore linear vs. exponential results of the given choices (printable PDF, Google Sheets, and Microsoft Excel versions included)Answer KeyExponential functions are a difficult concept for students because they are used to thinking about linear relations. Before telling students
Grades:
8th - 9th
Types:
CCSS:
Also included in: Algebra 1 Discovery Lessons and Inquiry Activities Bundle
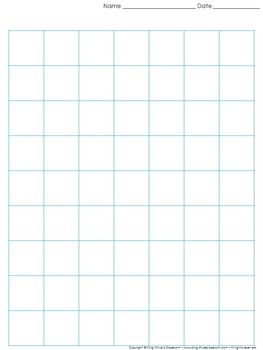
Graph Paper: Full Page Grid - 1 inch squares - 7x9 boxes - King Virtue
Graph Paper: Full Page Grid - 1 inch squares - 7x9 boxes - King Virtue's Classroom
Never run out of graph paper again! Use this item to print grid paper for math, science, and other classroom activities.
This set includes:
1 graph paper page
Enjoy!
:)
Copyright © King Virtue’s Classroom • www.kingvirtuesclassroom.com • All rights reserved.
Subjects:
Grades:
Not Grade Specific
Types:
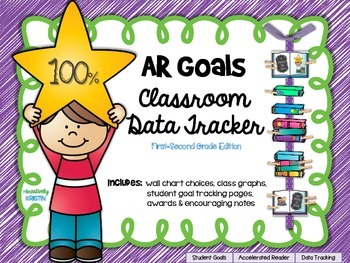
Accelerated Reader (AR) Goals Chart and Data Tracker {1st-2nd Grade Ed.}
Want a great way to see a SNAPSHOT of your classroom progress and help STUDENTS TRACK DATA for goal setting? This AR Goal Chart has all you need to set up your students for success! Just print, laminate and post on the wall - that's all!
Your Download Includes:
*Wall Chart by points or blank to write your own
*Instructions for posting
*Quarterly Class-at-a-Glance Graphs
*Monthly Class-at-a-Glance Graphs
*Student Points and Goal Data Graph
*Encouragement Notes for slower readers
*Bookmarks
*Aw
Grades:
1st - 2nd
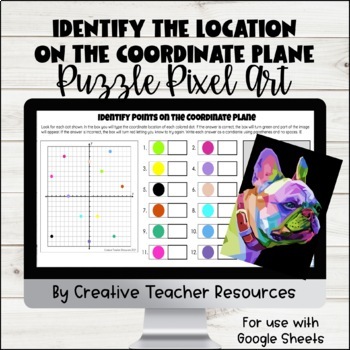
Coordinate Plane Ordered Pairs DIGITAL Puzzle Pixel Art
#touchdown23Students will write the ordered pair for each dot in this self-checking activity. As the questions are answers correctly, the answers will turn green and parts of the puzzle will appear. This activity includes 12 self-checking problems.If the question is answered incorrectly, the answer will turn red. No puzzle pieces will appear for that answer if it incorrect. This activity is ready to be used as soon as you purchase! As soon as you add it to your Google Drive it is ready to be ass
Grades:
5th - 6th
CCSS:
Also included in: 6th Grade Digital Activities Bundle | Distance Learning
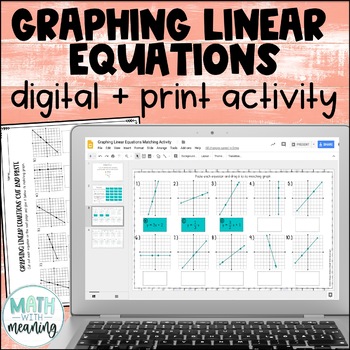
Graphing Linear Equations Digital and Print Activity for Google Drive
Looking for an engaging, no-prep activity to practice matching linear equations to their graphs? Students will match 20 equations to their graphs with this fun digital and print activity. Many of the equations are very similar and involve the same numbers, so students will need to work carefully!All equations are written in slope-intercept form. The graphs include positive, negative, zero, and undefined slopes. Please view the preview file to make sure that this activity is appropriate for your
Grades:
6th - 9th
CCSS:
Also included in: Middle School Math Digital and Print Activity Bundle Volume 2
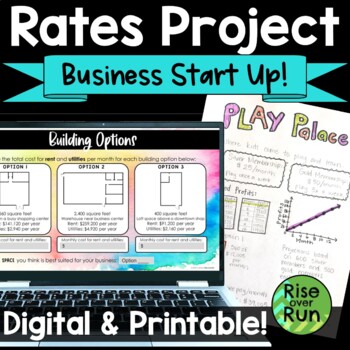
Rates & Proportional Relationships Real World Project
Students work with real world rate of change and proportional relations as entrepreneurs creating a business startup! They will love getting creative, and you will love that everything is ready to go to get them thinking about math. This project is included in printable PDF version, Google Slides, and PowerPoint.In this project, students get creative as they decide on a type of business, membership fees, and a building location. Then they must calculate their costs and profits based on those dec
Graph Paper: Full Page Grid - 1 centimeter squares - 19x25 boxes - no name line
Graph Paper: Full Page Grid - 1 centimeter squares - 19x25 boxes - no name line - King Virtue's Classroom
Never run out of graph paper again! Use this item to print grid paper for math, science, and other classroom activities.
This set includes:
1 graph paper page
Enjoy!
:)
Copyright © King Virtue’s Classroom • www.kingvirtuesclassroom.com • All rights reserved.
Subjects:
Grades:
Not Grade Specific
Types:
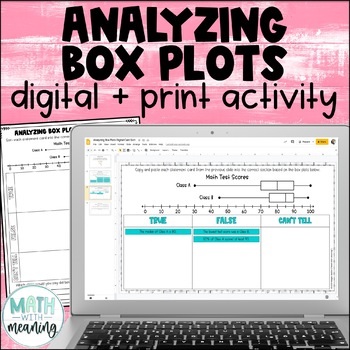
Box and Whisker Plot Digital and Print Card Sort - Reading and Analyzing
Looking for an engaging, no-prep activity to practice reading and analyzing box plots? Students will look at a double box plot and determine if statements about it are true, false, or if they can't tell from the information given in this fun digital and print activity.This activity includes statements about the minimum, maximum, median, quartile 1 (Q1), quartile 3 (Q3), interquartile range (IQR), and range of the box plots, along with statements about the percentages represented by a particular
Subjects:
Grades:
6th - 9th
Also included in: Middle School Math Digital and Print Activity Bundle Volume 3
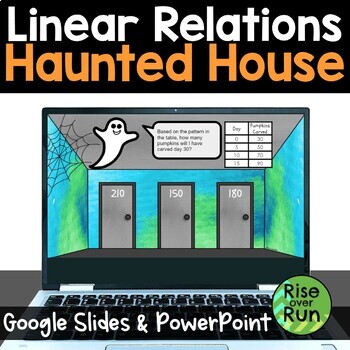
Digital Linear Relationships Halloween Escape Room Activity
Students will love this engaging practice activity for linear relationships. They must try to escape a haunted house! Includes Google Slides and PowerPoint versions. They are given 14 problems to solve, choosing from 3 possible answers for each one. If they solve correctly, they will choose the correct door and avoid the scary giant spiders! If they make a mistake, a spider appears, and they are prompted to try again. Problems include linear graphs, table of values, equations, and stories. Thi
Grades:
7th - 9th
Types:
CCSS:
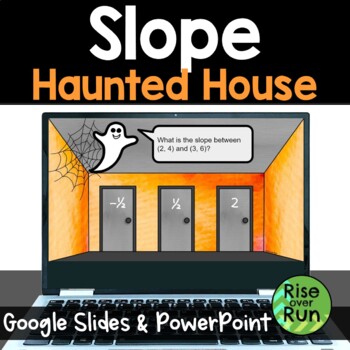
Slope Digital Math Escape Room Activity for Halloween
Students will love this fun practice activity for calculating slope between 2 points. Answering correctly will help them escape a haunted house! Includes Google Slides and PowerPoint versions. They are given 14 problems to solve, choosing from 3 possible answers for each one. If they solve correctly, they will choose the correct door and avoid the scary giant spiders! If they make a mistake, a spider appears, and they are prompted to try again. For each problem, students are given two ordere
Grades:
7th - 9th
Types:
Digital Notebook BUNDLE (VA 6.1, 6.2, 6.3. 6.4, 6.5, 6.6, 6.8)
Get this BUNDLE and save 15%! Includes: SOL 6.1, 6.2, 6.3, 6.4, 6.6a, 6.6b, 6.6c, 6.5abc, and 6.8. Aligned specifically for Virginia teachers, this covers the first semester (most counties). Distance education, 1:1, and works with both Google Slides(TM) and Microsoft OneDrive (TM). This resource was created especially for Virginia teachers and aligns with SOLs 6.1, 6.2, 6.3, 6.4, 6.5, 6.6, and 6.8. A 14-page instructional "how-to" is provided with pictures that explains how to upload, assign,
Subjects:
Grades:
6th
Accelerated Reader (AR) Goals Chart and Data Tracker {3rd-5th Grade Ed.}
Want a great way to see a SNAPSHOT of your classroom progress and help STUDENTS TRACK DATA for goal setting? This AR Goal Chart has all you need to set up your students for success! Just print, laminate and post on the wall - that's all!
Your Download Includes:
*Wall Chart by percentage or blank to write your own
*Instructions for posting
*Quarterly Class-at-a-Glance Graphs
*Monthly Class-at-a-Glance Graphs
*Student Points Conversion and Goal Data Graphs
*Encouragement Notes for slower reader
Grades:
3rd - 5th
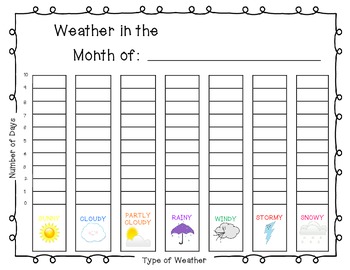
Weather Bar Graph
- Use this weather bar graph to collect daily data about the weather as part of your calendar routine. Save all the completed bar graphs and at the end of the school year have students analyze the data. Which month was the sunniest? How many more days did it rain in October than September? etc.
- Use it during your common core unit on data.
Graphics from: www.mycutegraphics.com
Grades:
K - 5th
Graph Paper: Full Page Grid - 1 inch squares - 7x10 boxes - no name line
Graph Paper: Full Page Grid - 1 inch squares - 7x10 boxes - no name line - King Virtue's Classroom
Never run out of graph paper again! Use this item to print grid paper for math, science, and other classroom activities.
This set includes:
1 graph paper page
Enjoy!
:)
Copyright © King Virtue’s Classroom • www.kingvirtuesclassroom.com • All rights reserved.
Subjects:
Grades:
Not Grade Specific
Types:
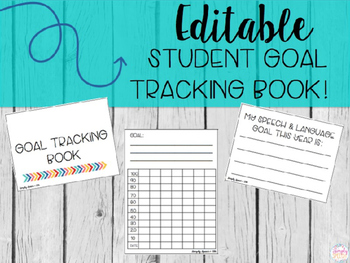
Editable Student Goal Tracking Book
These mini goal books are the perfect way to help your students keep track of their own goals. These books help increase student motivation and self awareness as they create their own personal goals and track their own progress.Here's what's included:Page 3: cover page options. This page is editable. Click on 'add text box' to add your students' names to their books.Page 4: Goal tracking sheets. Print as many of these pages as you need. This is also editable if you wish to type the goals in. Pag
Subjects:
Grades:
1st - 12th
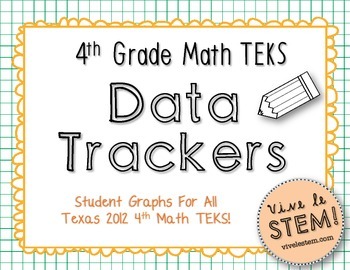
Fourth Grade Math TEKS Student Data Trackers
Use these student TEKS mastery trackers to help your fourth grade students track their math data throughout the year! These graphs are perfect for a data-driven math classroom in Texas and are simple enough for students to take ownership of their own tracking.
This file includes 10 student graphs, organized by math topic, plus a Data Folder cover sheet and two bonus blank graphs so you can customize for your student's needs! This is a perfect resource for student data binders or folders and can
Subjects:
Grades:
4th
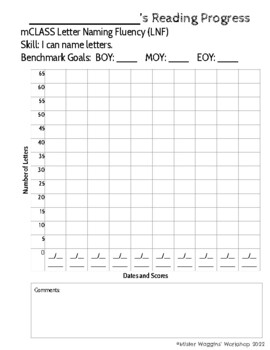
mCLASS Progress Monitoring Graphs for Students
These blank graphs make it easy for students to track their progress in mCLASS. Just choose the most foundational skill each student needs to work on and go! The mCLASS subtests included are LNF, PSF, NWF - CLS, NWF - WRC, ORF - Words Correct, ORF - Accuracy, and Maze. Each graph includes the subtest title, an "I can" statement, and blanks for your grade level's benchmark goals. The graphs all start at 0, but count by 2s, 5s, or 10s in order to accomodate the highest benchmark score; this allows
Grades:
K - 6th
Types:
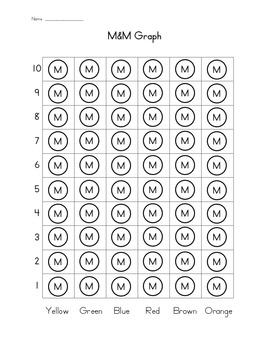
M & M Graph
Students are given a fun size bag of M&M's candy. They will sort the M&M's and then graph them on this sheet.
This work is licensed under a Creative Commons Attribution-NonCommercial-NoDerivs 3.0 Unported License.
Subjects:
Grades:
PreK - 1st
Types:
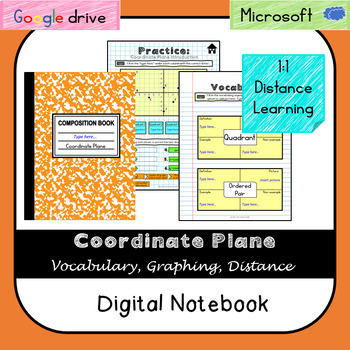
Coordinate Plane Digital Notebook (VA SOL 6.8) Distance Learning- Videos
Distance education, 1:1, and works with both Google Slides(TM) and Microsoft OneDrive (TM). This resource was created especially for Virginia teachers and aligns with SOL 6.8ab. Students will learn about vocabulary of the coordinate plane, how to graph and identify points on the coordinate plane, the difference between vertical/horizontal lines, and distance on the coordinate plane. A 14-page instructional "how-to" is provided with pictures that explains how to upload, assign, and grade this dig
Grades:
6th
Also included in: Digital Notebook BUNDLE (VA 6.1, 6.2, 6.3. 6.4, 6.5, 6.6, 6.8)
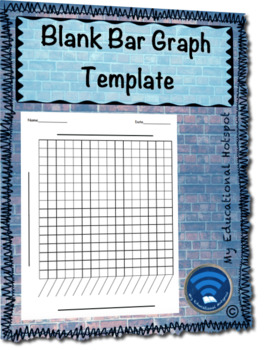
Blank Bar Graph Template
Check out this simple and organized template that has a labelled and specific sections for a bar graph. This outline is ideal for supporting students' understanding of graphing, for use with differentiation, or for modification for struggling students. Also, when used in science or social studies, when the lesson isn't on graphing, this can cut out a lot of wasted time. Presented in a simple and student-friendly way, the possibilities for implementation are endless!
Grades:
2nd - 10th
Showing 1-24 of 420 results


