31 results
Middle school graphing simulation microsofts
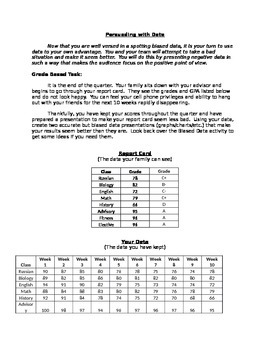
Persuading with Data: Using data bias to your advantage
The activity is designed as a follow-up to my Data Bias activity (posted for free). Student use what they learned about data bias to create data presentations (graphs, charts) that help prove their point. Multiple scenarios are given where students are trying to convince their parents that their grades/behavior aren't bad.
This activity helps students internalize the power of data bias and makes them more likely to look out for this bias in the real world. This makes for a really fun homew
Subjects:
Grades:
7th - 10th
Types:
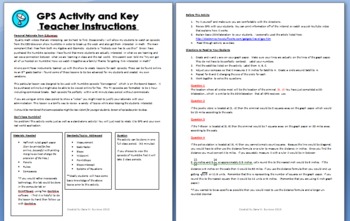
GPS Simulation - Applications of Algebra and Geometry - Aligned with Numb3rs
Are you tired of hearing your students say "When would you ever use this!?" This lesson is a perfect way to silence their complaints!
I originally designed this lesson to be used after watching the episode "Convergence"of the CBS television series Numb3rs. I think every middle/HS teacher should own copies of this series. If you aren't familiar with the show, it is basically a crime show where the characters solve crimes with math. (Similar to CSI) You might be able to download free episodes
Grades:
8th - 12th
Types:
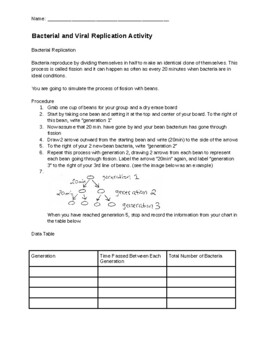
Bacterial and Viral Replication Lab
This lab requires you to have raw beans (any kind to model bacteria) and whiteboards for students to draw a family tree and write out generation numbers next to each bacterial generation. (You could also do this on paper.)This lab is a great way for students to simulate bacterial and viral reproduction. For the bacteria, students will model the number of bacteria in each generation starting with only one bacterium (represented by a bean). With each generation, students will watch as the family t
Subjects:
Grades:
8th - 9th

Small Intestine Simulation- Villi at Work
For use with my M'Kenna Lessons 7 & 8. Student work packet. Includes running the simulation, collecting data, finding averages, rounding to the nearest tenth, graphing on paper and the computer, and answering reflection questions.
Grades:
6th - 8th
Types:
Also included in: M'Kenna Unit | In Person

Orangutan Population Simulation Packet
To be used with Ecosystems Lesson 7, 8 & 9.Students look at how changing the amount of fruit trees affects the energy of individual orangutans as well as the population as a whole. Involves data collection and graphing.
Grades:
6th - 8th
Types:
Also included in: Ecosystems Unit
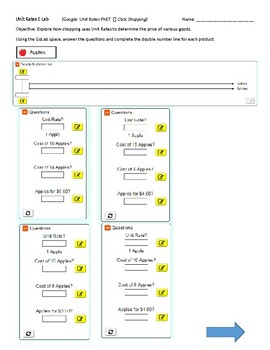
Interactive Online ELab Simulations Lab - Shopping Unit Rates Lab
In this FREE online interactive simulation provided by PhET, developed by the University of Colorado, students will explore unit rates through the process of buying goods. Students will explore how shopping uses unit rates to determine the price of various goods. Students will need a computer, tablet or IPad. These simulations were designed for IPad use. This handout goes directly with the Elab and contains directions on accessing the lab online as well as directions on how to complete the lab.
Subjects:
Grades:
5th - 8th
Types:

Ordered Pairs: Quadrants & Signs
This 16-slide PowerPoint presentation stresses quadrant location and the signs of the ordered pairs that fall into each particular quadrant. It assumes prior knowledge of plotting & identifying points in the coordinate plane. Examples lead students to try to first figure out on their own what a set of un-plotted order pairs have in common. The pairs will fall in the same quadrant and all x-coordinate signs will match as well as all y-coordinates matching. Students can take a 5-question quiz
Grades:
6th
CCSS:
Number Lines: Distance between Points
This 23-slide PowerPoint presentation is recommended as useful instruction before learning to calculate distance between points in a coordinate plane (CCSS.MATH.CONTENT.6.NS.C.8). It is meant for students who have already learned about absolute value, but have not learned about basic operations involving negative numbers yet (i.e. addition/subtraction). Students will learn how to calculate the distance between any two points on a number line using their absolute values. They will see that this s
Subjects:
Grades:
6th
CCSS:

Ordered Pairs: Sign Changes & Reflections
This 20-slide PowerPoint presentation tests and develops three rules involving reflections resulting from sign changes in an ordered pair. The three rules involve changing the x-coordinate sign only, changing the y-coordinate sign only, and changing both coordinate's signs. Thus the result is reflection across the y-axis, reflection across the x-axis, and reflection across the origin, respectively. Students are expected to have previous knowledge of plotting & identifying ordered pairs, iden
Grades:
6th
CCSS:

Statements of Inequality: Writing, Explaining & Interpreting
This 16-slide PowerPoint presentation uses a three-step process to compare different numbers. Writing a statement of inequality using the numbers an correct inequality symbol is the 1st step. Explaining in words what the statement of inequality means is the 2nd step. The 3rd step is to interpret the relative position of each number on a number line (both horizontal & vertical number lines are used). Positive & negative numbers are both used in examples. Those viewing this presentation ha
Grades:
6th

A Fishy Situation
The multiple day activity is a simulation requiring students to collect, organize, categorize, and analyze data concerning a fish population in a lake. Students will discuss sampling, create various graphs, and create their own research plan. Career ties may be biologist, state wildlife and fisheries agents, and environmentalist.
Subjects:
Grades:
6th - 8th
Types:

The Coordinate Plane: Points in Two Dimensions
This 22-slide PowerPoint presentation serves as an introduction to the coordinate plane. It begins by defining a coordinate plane and explaining its uses. Then construction of the plane, its parts, and terminology are covered. The rest of the presentation explains and simulates how to plot ordered pairs and how to determine ordered pairs for points already plotted. Fractional values and coordinates of zero are included in the simulation as well. The content is based on Common Core standard CCSS.
Grades:
6th
CCSS:
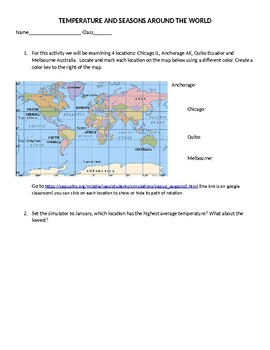
Reasons For Seasons
Students will use an online simulation to investigate how the tilt of the Earth causes seasonal patterns at various latitudes.This activity takes my ninth graders about 35 min.
Subjects:
Grades:
8th - 10th
Types:
NGSS:
HS-ESS2-4
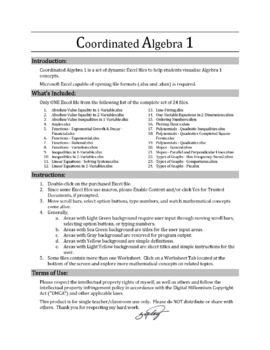
Demonstrate Linear Equations in 2 Variable Graphs with an Animated Excel File
Simple to use animated Excel file for in class demonstration of Linear Equations in 2 Variables. Equation formats include general form, slope-intercept form, point-slope form, and point-point form. Move scroll bars, select option buttons, type numbers, and watch these mathematical concepts come alive. You must use Microsoft Excel that is capable of opening file formats in either .xlsx or .xlsm.
Subjects:
Grades:
8th - 12th
Types:
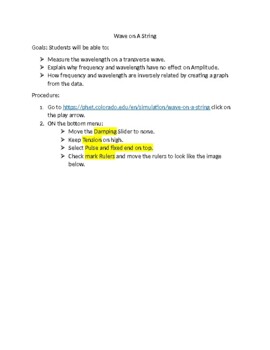
Wave on a String Virtual PHET Lab
Goals: Students will be able to:Ø Measure the wavelength on a transverse wave.Ø Explain why frequency and wavelength have no effect on Amplitude.Ø How frequency and wavelength are inversely related by creating a graph from the data.
Subjects:
Grades:
7th - 11th, Adult Education
Types:
NGSS:
MS-PS4-1
, HS-PS4-1
Also included in: Physical Science Virtual Lab Bundle
Demonstrate Absolute Value Equality in 2 Variables with an Animated Excel File
Simple to use animated Excel file for in class demonstration of solutions to absolute value equalities in 2 variables such as y=|x|, y=a|x|, y=a|x+b|, and y=a|x+b|+c. Move scroll bars, select option buttons, type numbers, and watch these mathematical concepts come alive. You must use Microsoft Excel that is capable of opening file formats in either .xlsx or .xlsm.
Grades:
7th - 12th
Types:
Demonstrate Absolute Value Equalities in 1 Variable with an Animated Excel File
Simple to use animated Excel file for in class demonstration of solutions to absolute value equalities in 1 variable such as |x|=d, |x-b|=d, a|x-b|=d, and a|x-b|+c=d. Move scroll bars, select option buttons, type numbers, and watch these mathematical concepts come alive. You must use Microsoft Excel that is capable of opening file formats in either .xlsx or .xlsm.
Grades:
7th - 12th
Types:

Photosynthesis Simulation Packet
For use with Photosynthesis Lesson 8. Students collect data, graph it in two ways, and analyze it.
Grades:
6th - 8th
Types:
Also included in: Photosynthesis Unit
Demonstrate One-Variable Equations in 2-Dimensions with an Animated Excel File
Simple to use animated Excel file for in class demonstration of One-Variable Equations in 2-Dimensions. Graph types include vertical (x=c), horizontal (y=c), and both types on one graph. Move scroll bars, select option buttons, type numbers, and watch these mathematical concepts come alive. You must use Microsoft Excel that is capable of opening file formats in either .xlsx or .xlsm.
Subjects:
Grades:
7th - 12th
Types:
Paper Tower Project
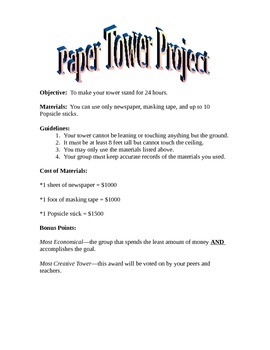
Students use a budget to build the most economical tower. They use graphing skills to graph class data. Rubric is attached
Subjects:
Grades:
5th - 8th
Types:
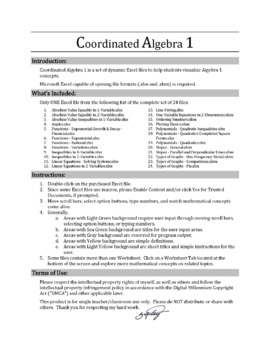
Demonstrate Basic Statistics Plots with an Animated Excel File
Simple to use animated Excel file for in class demonstration of Basic Stem-n-Leaf plot, Box and Whisker plot, and Frequency plot. Move scroll bars, select option buttons, type numbers, and watch these mathematical concepts come alive. You must use Microsoft Excel that is capable of opening file formats in either .xlsx or .xlsm.
Grades:
6th - 12th
Types:
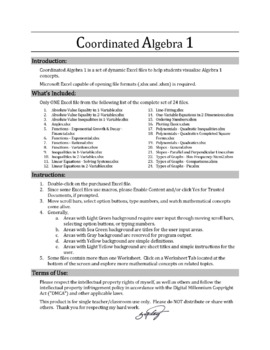
Demonstrate Compare Basic Statistical Graphs with an Animated Excel File
Simple to use animated Excel file for in class demonstration of comparing basic statistical graphs such as XY-scatter, Line, Column, Bar/Histogram, Area, and Pie, with the ability to select Ribbon, 3-d Column, 3-d Bar, 3-d Area, or 3-d Pie. Move scroll bars, select option buttons, type numbers, and watch these mathematical concepts come alive. You must use Microsoft Excel that is capable of opening file formats in either .xlsx or .xlsm.
Grades:
6th - 12th
Types:
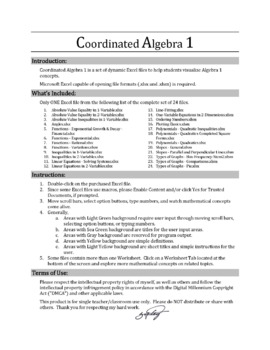
Demonstrate Slopes of Parallel & Perpendicular Lines with an Animated Excel File
Simple to use animated Excel file for in class demonstration of Slopes of Parallel and Perpendicular Lines. Move scroll bars, select option buttons, type numbers, and watch these mathematical concepts come alive. You must use Microsoft Excel that is capable of opening file formats in either .xlsx or .xlsm.
Grades:
7th - 12th
Types:
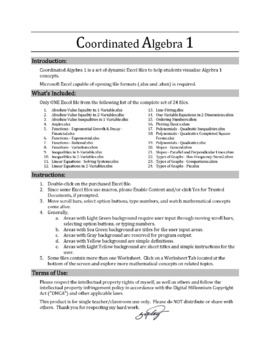
Demonstrate Graph Plotting Basics with an Animated Excel File
Simple to use animated Excel file for in class demonstration of Basic Graph Plotting. Move scroll bars, select option buttons, type numbers, and watch these mathematical concepts come alive. You must use Microsoft Excel that is capable of opening file formats in either .xlsx or .xlsm.
Grades:
7th - 12th
Types:
Showing 1-24 of 31 results


