8 results
Middle school graphing simulations for Google Apps

Teach Students to Make a Survey & Presentation with Google Forms & Slides
Show your students how to create a poll/survey using Google forms. This easy-to-follow slides presentation shows students how to make and customize a survey, make a QR code with a direct link to the survey, and use the results to make a presentation for the class using graphs from their data.
Subjects:
Grades:
5th - 12th
Types:

Small Intestine Simulation- Villi at Work
For use with my M'Kenna Lessons 7 & 8. Student work packet. Includes running the simulation, collecting data, finding averages, rounding to the nearest tenth, graphing on paper and the computer, and answering reflection questions.
Grades:
6th - 8th
Types:
Also included in: M'Kenna Unit | In Person

Orangutan Population Simulation Packet
To be used with Ecosystems Lesson 7, 8 & 9.Students look at how changing the amount of fruit trees affects the energy of individual orangutans as well as the population as a whole. Involves data collection and graphing.
Grades:
6th - 8th
Types:
Also included in: Ecosystems Unit
M'Kenna Lesson 8 | In Person
Based on OpenSciEd's Metabolic Reactions unit. Students finish their graphs from the villi simulation. They complete a graph on paper and using a spreadsheet, then answer reflection questions. Students should decide that taller villi allow for more food absorption because they have more cells, and more cells mean more "doorways" the food molecules can go through. Most will also decide that M'Kenna's villi are probably short or flat. If they need further evidence they can think about the small in
Grades:
6th - 8th
Types:
Also included in: M'Kenna Unit | In Person
M'Kenna Lesson 7 | In Person
Based on OpenSciEd's Metabolic Reactions unit, now for in person learning. Students look at pictures of villi without knowing what they are and complete a notice & wonder chart. Then students are told that they are villi and begin the simulation to see how villi height & number of cells affects the amount of food molecules that can be absorbed into the bloodstream.
Grades:
6th - 8th
Types:
Also included in: M'Kenna Unit | In Person
Choosing a Sale Price
In this activity, students will discover how to choose an appropriate price for a product based on demand, cost, and profit. Students will discover that charging too little for a product will negate profits but charging too much will affect sales. Students will calculate profit and graph data on a coordinate plane.
Grades:
6th - 7th

Photosynthesis Simulation Packet
For use with Photosynthesis Lesson 8. Students collect data, graph it in two ways, and analyze it.
Grades:
6th - 8th
Types:
Also included in: Photosynthesis Unit
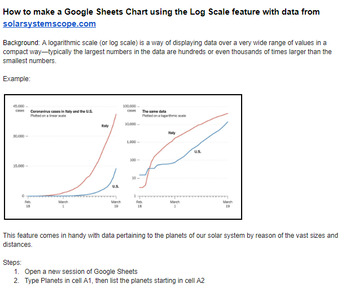
Google Sheets Chart using Log Scale feature with data from solarsystemscope.com
Instructions on how to make a Google Sheets Chart using the Log Scale feature with data from solarsystemscope.com
Subjects:
Grades:
5th - 12th, Higher Education, Adult Education
Types:
Showing 1-8 of 8 results


