67 results
Free middle school graphing internet activities
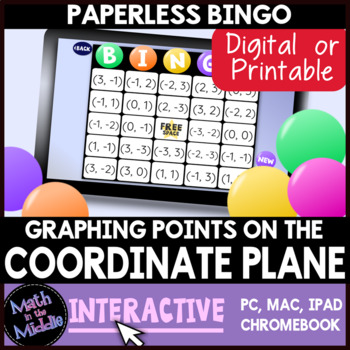
FREE Graphing Points on the Coordinate Plane Digital Bingo Game - Paperless
Review plotting points in 4 quadrants on the coordinate plane with this fun and engaging no-prep digital Bingo game! Your students will love this unique paperless web-based game, whether they are in a traditional classroom or virtual learning environment!This free game features 26 different questions that ask students to name the ordered pair of a given point on the coordinate plane. Points are plotted in all 4 quadrants and on the x and y axes for this game.** Click here for a similar game tha
Grades:
5th - 8th
Types:
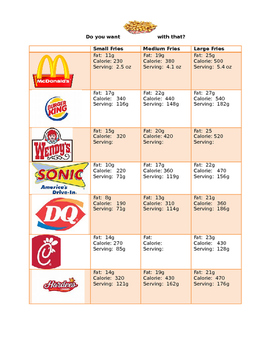
French Fry Scatter Plot & Best Line of Fit
Students will compare the nutritional values and serving sizes of french fries from various fast food restaurants. Based on this information, they will create scatter plots, best lines of fit and the equation of the trend line. Using the equation, they will estimate the unknown values of kid meals and supersized portions of french fries.
Subjects:
Grades:
8th - 11th
Types:
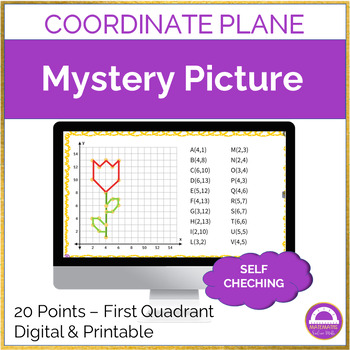
FREEBIE | Plotting Points on a Coordinate Plane Mystery Picture
Looking for a fun and engaging way to teach coordinate planes and plotting points?Look no further than our digital and printable mystery picture activity!Perfect for students of all ages, this activity focuses exclusively on the first quadrant and is designed to help reinforce important mathematical concepts while keeping students entertained and engaged.Whether you're a teacher looking for a new way to spice up your lesson plans or a parent looking for an educational activity for your child, ou
Grades:
5th - 7th
Types:
Also included in: Coordinate Plane Activities Growing Bundle 50% Discount
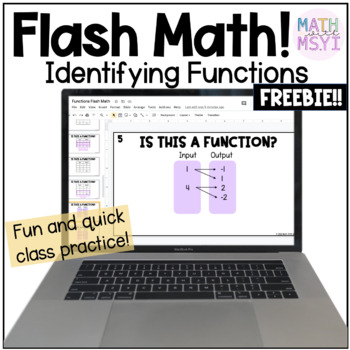
Identifying Functions Flash Math Freebie
Need to quickly review identifying functions with your class? This is a fun and quick way to do that! Includes functions in the form of tables, mapping diagrams, points and graphs. Great way to check student's content knowledge while teaching virtually. Note this is a sample of my full product Identifying Functions Flash Math and includes 5 of the original 12 questions. + Don't forget to leave feedback to earn TPT credits for future purchases!+ If you use this resource, I'd love to see snaps of
Subjects:
Grades:
8th
Types:
CCSS:
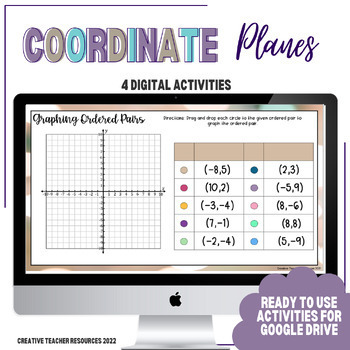
Coordinate Plane Digital Activities
Activities Included:Name That Point (Type the Coordinate)Plot That Point (Drag and Drop)Ordered Pairs Quadrant SortDirections on the Coordinate PlaneThese digital activities focus on practicing skills on the coordinate plane, such as plotting points, writing ordered pairs, determining the quadrant location for a ordered pair and identifying the directions you take to plot a ordered pair This resource is made to be used with Google Slides. It can be assigned directly to your students through Goog
Grades:
6th
Also included in: 6th Grade Digital Activities Bundle | Distance Learning
FREE Analyzing Data & Interpreting Graphs Digital Task Cards for BOOM Learning
A great option for distance learning, these nine digital task cards are about data analysis and graph interpretation of line graphs, bar graphs, and pie charts. There are three graphs, each with three different questions. The three questions per graph gradually increase in difficulty. The question types include typing the correct response, answering True or False, and clicking the correct responses.These digital task cards work on laptops, desktops, Smart Boards, Chromebooks, tablets, and any ot
Subjects:
Grades:
5th - 8th
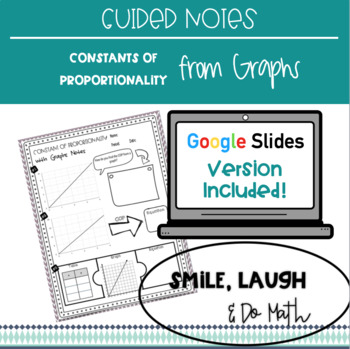
The Constant of Proportionality from Graphs - Guided Notes
These guided notes help students to find the constant of proportionality from graphs as well as translate between formats (equations, tables and graphs). These notes focus on the following skills: Finding the constant of proportionality in graphs Writing an equation from a graph Translating between graphs, equations and tables. What's included: 1 page of guided notes (printable) 1 page of guided notes (digital version on Google Slides) **Note: You will have to first make a copy and then distribu
Grades:
7th - 8th
Types:
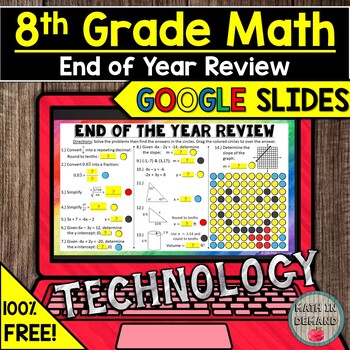
FREE 8th Grade Math End of the Year Review in Google Slides Distance Learning
In this FREE resource, students will be solving various math problems on 8th grade math. Students will drag colored colors according to their answers. This helps with self assessment! A mystery picture will be revealed once they complete the activity. I have embedded a video that shows how to complete the activity and how to upload the student's work.You will be provided with a link that you can distribute to your students through Google Classroom or etc.I also have this same template for FREE
Grades:
8th
Types:
Also included in: DIGITAL MIDDLE SCHOOL MATH GOOGLE SLIDES DISTANCE LEARNING RESOURCES
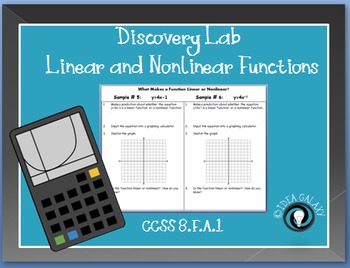
Linear Functions and Nonlinear Functions Discovery Lab
Students will get a great introduction to linear and nonlinear functions in this interactive discovery activity (Supports 8th grade standard CCSS 8.F.A.3 ). Using a graphing tool, students will compare linear and nonlinear functions, drawing their own conclusions on the attributes of each.
***This product is included in the Linear and Nonlinear Functions Games and Activities BUNDLE***
Included in this 13 page download is:
-Teacher directions and tips
-Powerpoint presentation for teachers to
Grades:
7th - 9th
Types:
Also included in: Linear and Nonlinear Functions Activities Bundle
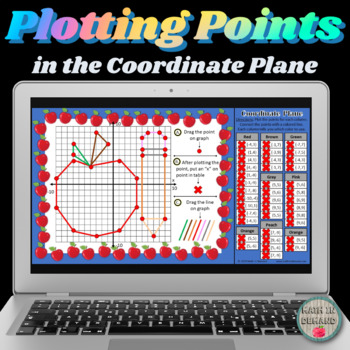
FREE Plotting Points in the Coordinate Plane DIGITAL in Google Slides
This is a FREE DIGITAL resource in Google Slides. Students will be plotting points in the coordinate plane to reveal a mystery picture.Like this activity and want more? Check out my BUNDLE!!!
Grades:
5th - 7th
Types:
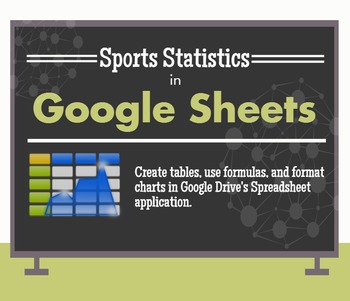
Manage Sports Statistics in Google Drive / Google Sheets - Activity
Use Google Sheets to analyze sports data
This activity lets students practice several fundamental spreadsheet skills, including:
-renaming documents
-adding formulas
-inserting / formatting charts
Screenshots demonstrate how to do all of the above in Google Sheets, the spreadsheet application in the Google Drive suite. You can add additional statistics to customize the assignment for your students and adjust the level of difficulty.
Aligned to the following Massachusetts Technology Literacy
Grades:
5th - 8th
Types:
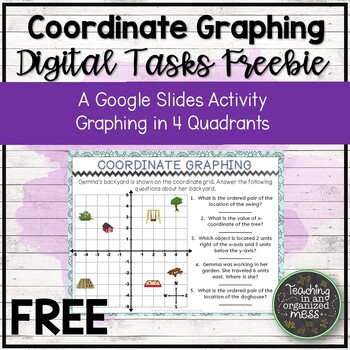
FREE Coordinate Graphing in Four Quadrants Google Slide Activity
Students will answer questions about graphing on the coordinate plane with all four quadrants. There are 2 slides included. You and your students will need to have access to Google Drive in order to access this activity.Instructions are includes on how to assign this activity to students.Customer Tips:How to get TPT credit to use on future purchases:Please go to My Purchases page. Underneath the product name you'll see a Provide Feedback button. Click it and you'll be taken to a page where you c
Grades:
6th
Types:
CCSS:
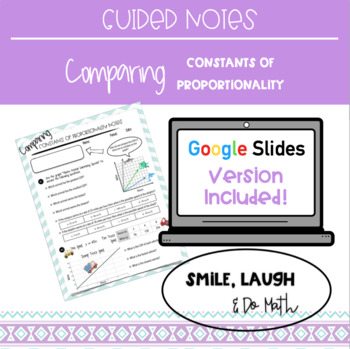
Guided Notes: Comparing the Constants of Proportionality
These guided notes help students to compare constants of proportionality primarily from graphs.These notes focus on the following skills:Determining the largest/smallest constant of proportionality from looking at a line's steepness Finding the constant of proportionality in graphs, equations and tables Answering questions about a graph (such as which is faster or slower) What's included:1 page of guided notes (printable)1 page of guided notes (digital version on Google Slides) **Note: You will
Grades:
6th - 8th
Types:
CCSS:

FREE Proportional Relationships Digital Notes Graphic Organizer
This FREE digital graphic organizer uses Google Slides to help students see proportional relationships in multiple representations- by a verbal description, table, graph, and equation. Students will type in text boxes to fill in the blanks and drag a line to complete the graph to show proportional relationships represented various ways. You can even have them highlight the constant of proportionality from each representation. There is also an option to print this notes page.Please follow me! - 8
Position vs. Time Graphs: Grasshopper vs. Snail Interactive + Worksheet
This worksheet compliments the free online Virtual Science Teachers Position vs. Time Graphs: Snail vs. Grasshopper interactive. The provided printable graphic can be used in place of using the online interactive.Note: Test out the free part of the activity by clicking on this link. Be sure it works in the classroom and is not blocked by your school district.Students fill out the printed worksheet as they work through the interactive. Please note that the worksheet includes many questions tha
Subjects:
Grades:
5th - 10th
Types:
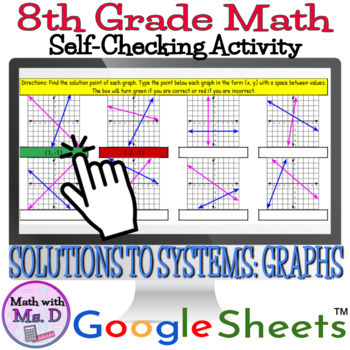
Self Checking Solving Systems of Equations Graphs Digital Activity
Looking for a no prep, engaging way for students to practice solving systems of equations on a graph? Check out this Self-Checking Activity perfect for independent practice or review!Check out the thumbnails to see the product!Based on 8th Grade Common Core Standards -This digital self checking activity includes:8 problems with graphs of systems of equations Each graph has one solution - if the correct solution point is entered, the box will turn green; if an incorrect point is entered, the box
Subjects:
Grades:
8th - 9th
Types:

FREEBIE: Welcome Back First Day of School Goals for Google Slides/Pear Deck
This first day or week of school product includes a digital Google Slides presentation with a PearDeck add-on. The slides can be used alone for a class presentation but are meant to be used with the Pear Deck add-on. Simply open the slides, make a copy, go to Add-ons → Pear Deck and then click the green “start lesson” button on the right hand side where the Pear Deck options pop up. Using a free Pear Deck account to present this to your class either in person or remotely allows for student en
Grades:
4th - 12th
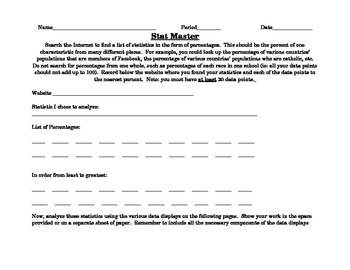
Stat Master- Statistics Analysis and Data Displays
This web-based performance task allows students to find statistics on the internet and the analyze and display the statistics using various displays. Finally, students are prompted to write about their analysis, explaining when specific displays are used and justifying their choice of a given display.
The data analysis and displays included are:
-Measures of Central Tendency (mean, median, mode)
-Measures of Variation (extremes, quartiles, or five-point summary)
-Box-and-Whisker Plot (or Box p
Subjects:
Grades:
5th - 9th
Types:
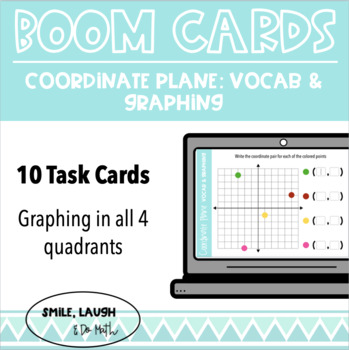
BOOM CARDS: Coordinate Plane Vocabulary and Graphing
These task cards are a great no-prep way for students to practice coordinate graphing in all four quadrants digitally! Students will complete interactive problems about plotting points, coordinate plane vocabulary and determining coordinate pairs all while receiving immediate feedback. These 10 digital task cards cover: Coordinate plane vocabulary (x-axis, y-axis and origin) Plotting points in all four quadrants Determining the coordinate pair from a point on the graph New to Boom? Boom Cards ar

Drawing Polygons in the Coordinate Plane - Playlist and Teaching Notes
Students explore standard 6.G.A.3 with this playlist. They will practice drawing polygons in the coordinate plane given the coordinates of the vertices. They will find the length of a side of a polygon that joins points with the same x-coordinate or the same y-coordinate. Students also have the option to view instructional videos and complete practice quizzes or activities.This product includes:• 6 links to instructional videos or texts• 3 links to practice quizzes or activities• Definitions of

Virtual Heating ICE Lab, Graphing, NO PREP
Ready-to-Go Lesson on Graphing Temperature DataThis worksheet is designed to accompany the Virtual Science Teachers Heating Ice Lab as a guided practice for collecting, graphing, and analyzing data. If your students have access to computers, then this lesson is all ready to go! Just provide students the worksheet and a link to the interactive. Students record and graph the temperature measurements as the simulated beaker of ice melts and eventually boils. Students then use their graph to answe
Subjects:
Grades:
5th - 9th
Types:
NGSS:
MS-PS1-4
, MS-PS1-2
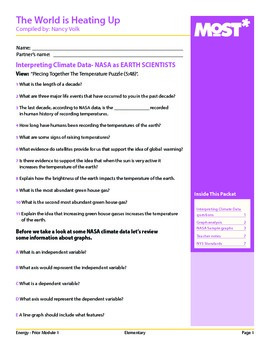
Graphing Using NASA Data: The World Is Heating UP
Teach graphing skills using real NASA data about climate change. This module integrates common core math skills with science standards. Students will amaze you with their ability to learn from real world data. Become familiar with the NASA resources for your classroom at "climate.nasa.gov".
Subjects:
Grades:
4th - 9th
Types:

FREE Among Us Escape Room - Integers Graphing
This escape room is a fun way to review integers, graphing and other 6th grade number systems standards! Your students will forget they are doing math as they complete tasks from the popular game Among Us. This activity is self-grading and there is no prep involved!Topics covered in this activity:1. Integers in the real world2. Compare and order integers3. Opposites4. Absolute value5. Points on a coordinate plane6. Find fistance between points7. Identify quadrantsYou might also like:Integers Gui
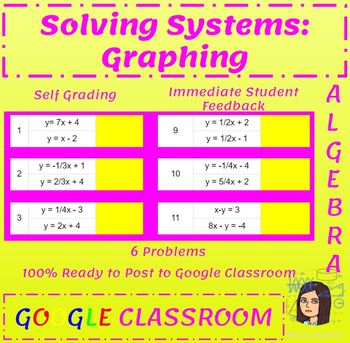
Solving Systems by Graphing - Google Sheet
16 solving systems problems on a Google Sheet. The Sheet is conditionally formatted so the box containing the answer will turn green and make grading effortless. Both Slope-Intercept Form and Standard Form equations are used.
There is no graph paper attached, my classes do their work on whiteboard graphs.
Be sure to make a copy of the Sheet and put it in your drive so you can edit it if needed.
Want more on Systems?
Solving Systems by Substitution
Solving Systems by Elimination
Chapter Bund
Subjects:
Grades:
8th - 11th
Showing 1-24 of 67 results


