105 results
Free graphing internet activities
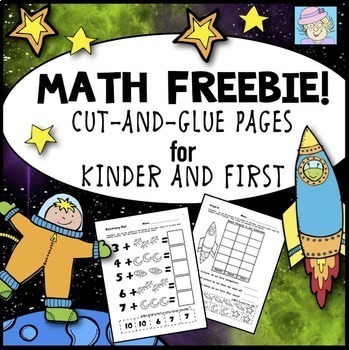
Kindergarten 1st Grade Math Worksheets with Boom Cards
You can use this resource via Google Classroom, Schoology, Edmodo, etc. This product comes with 20 printable pages AND a set of DIGITAL Boom Cards! This set for kindergarten and 1st grade covers making 10, addition, subtraction, place value, measurement, shapes, and more! There are at least 10 cut-and-glue workbook pages to address the Common Core Standards* of each grade. Some of the pages address the standards in both grades. Scroll down to read more about Boom Cards.CLICK HERE TO PLAY A PREVI
Subjects:
Grades:
K - 1st
Types:
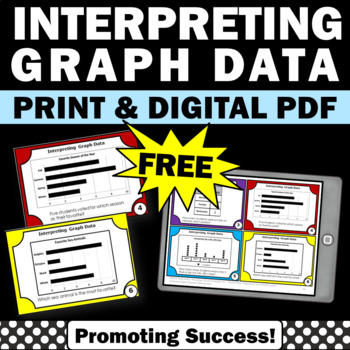
FREE Interpreting Bar Graphs and Data Task Cards 2nd 3rd Grade Math Center Games
DIGITAL PDF AND PRINTABLES: You will download six free task cards for your second grade and third grade students to practice interpreting graphs. You may use the printable task cards in math centers or stations for fun review games and activities, such as a scavenger hunt or SCOOT. They also work well for transition activities, as exit tickets and for morning work, quick formative assessments. Game ideas, a student response form and answer key are included.✔︎ Common Core Math Standards Lesson P
Subjects:
Grades:
2nd - 4th
Types:
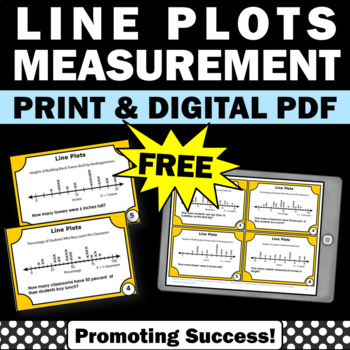
FREE Line Plots Measurement Task Cards 2nd Grade Math Review Centers Games
DIGITAL PDF AND PRINTABLES: You will download six FREE task cards for 2nd or 3rd grade students to practice line plots. You may use the printable task cards in math centers or stations for fun review games and activities, such as a scavenger hunt or SCOOT. They also work well for transition activities, as exit tickets and for morning work, quick formative assessments. Game ideas, a student response form and answer key are included.➔➔ Click HERE for 30 more line plots task cards.➔➔ Click HERE for
Subjects:
Grades:
2nd - 3rd
Types:
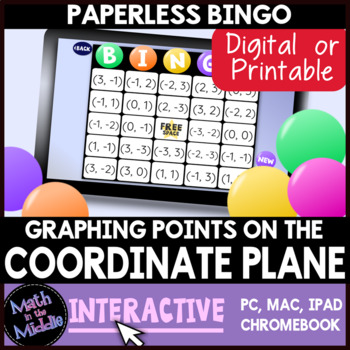
FREE Graphing Points on the Coordinate Plane Digital Bingo Game - Paperless
Review plotting points in 4 quadrants on the coordinate plane with this fun and engaging no-prep digital Bingo game! Your students will love this unique paperless web-based game, whether they are in a traditional classroom or virtual learning environment!This free game features 26 different questions that ask students to name the ordered pair of a given point on the coordinate plane. Points are plotted in all 4 quadrants and on the x and y axes for this game.** Click here for a similar game tha
Grades:
5th - 8th
Types:
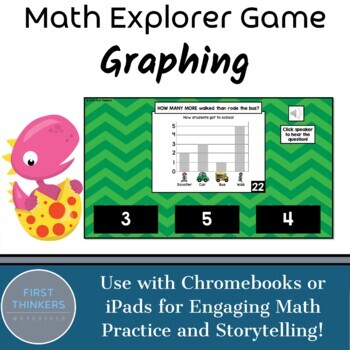
1st Grade Graphing Google Slides PowerPoint Digital Math Game Free
This graphing math activity is a great way to introduce engaging interactive practice to both your math centers and distance learning at home through Google Classroom or Seesaw. Explorer Math enhances both student motivation and engagement by giving students a choice on where to start first and differentiating content. Ultimately, this game will help your students gain mastery in a myriad of concepts!✨Get the full year bundle here and save lots of money!✨Equal or Not Equal10 More 10 Less1 More 1
Grades:
K - 2nd
Types:
CCSS:
Also included in: BUNDLE Full Year Math Games Google Slides PowerPoint Digital Interactive
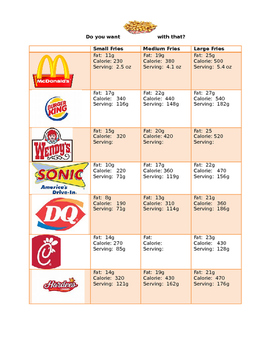
French Fry Scatter Plot & Best Line of Fit
Students will compare the nutritional values and serving sizes of french fries from various fast food restaurants. Based on this information, they will create scatter plots, best lines of fit and the equation of the trend line. Using the equation, they will estimate the unknown values of kid meals and supersized portions of french fries.
Subjects:
Grades:
8th - 11th
Types:
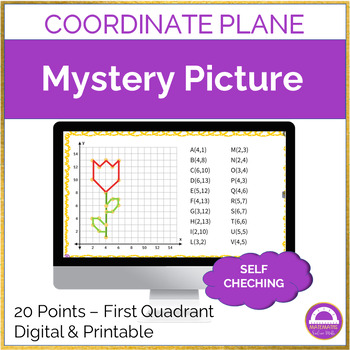
FREEBIE | Plotting Points on a Coordinate Plane Mystery Picture
Looking for a fun and engaging way to teach coordinate planes and plotting points?Look no further than our digital and printable mystery picture activity!Perfect for students of all ages, this activity focuses exclusively on the first quadrant and is designed to help reinforce important mathematical concepts while keeping students entertained and engaged.Whether you're a teacher looking for a new way to spice up your lesson plans or a parent looking for an educational activity for your child, ou
Grades:
5th - 7th
Types:
Also included in: Coordinate Plane Activities Growing Bundle 50% Discount
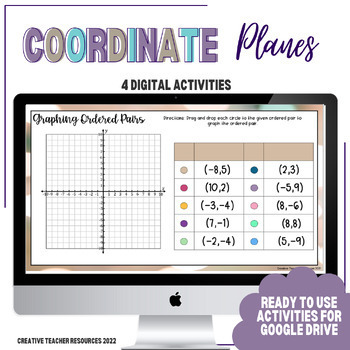
Coordinate Plane Digital Activities
Activities Included:Name That Point (Type the Coordinate)Plot That Point (Drag and Drop)Ordered Pairs Quadrant SortDirections on the Coordinate PlaneThese digital activities focus on practicing skills on the coordinate plane, such as plotting points, writing ordered pairs, determining the quadrant location for a ordered pair and identifying the directions you take to plot a ordered pair This resource is made to be used with Google Slides. It can be assigned directly to your students through Goog
Grades:
6th
Also included in: 6th Grade Digital Activities Bundle | Distance Learning
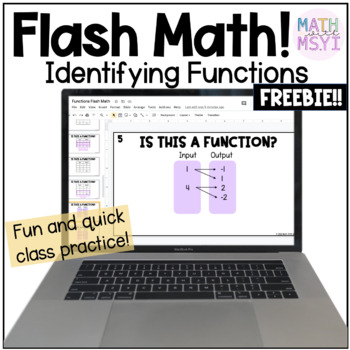
Identifying Functions Flash Math Freebie
Need to quickly review identifying functions with your class? This is a fun and quick way to do that! Includes functions in the form of tables, mapping diagrams, points and graphs. Great way to check student's content knowledge while teaching virtually. Note this is a sample of my full product Identifying Functions Flash Math and includes 5 of the original 12 questions. + Don't forget to leave feedback to earn TPT credits for future purchases!+ If you use this resource, I'd love to see snaps of
Subjects:
Grades:
8th
Types:
CCSS:
FREE Analyzing Data & Interpreting Graphs Digital Task Cards for BOOM Learning
A great option for distance learning, these nine digital task cards are about data analysis and graph interpretation of line graphs, bar graphs, and pie charts. There are three graphs, each with three different questions. The three questions per graph gradually increase in difficulty. The question types include typing the correct response, answering True or False, and clicking the correct responses.These digital task cards work on laptops, desktops, Smart Boards, Chromebooks, tablets, and any ot
Subjects:
Grades:
5th - 8th
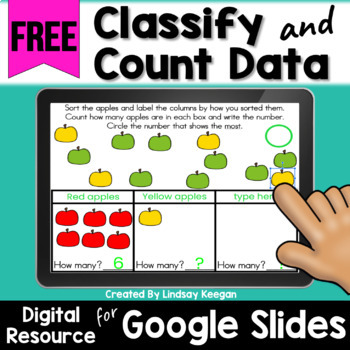
Classify and Count Data Digital Activities Google Classroom
Learning about classifying and counting data is super fun when using digital activities in Google Classroom and Google Slides. In this digital resource, students have fun sorting and classifying objects as well as using graphs to count data. These activities can easily be separated and assigned over several lessons.*Grab these and many more kindergarten math digital activities at a discount here:Digital Kindergarten Math Activities Bundle for Google ClassroomActivities included in these free dig
Subjects:
Grades:
PreK - 1st
Types:
CCSS:
Also included in: Kindergarten Math Digital Activities Bundle for Google Classroom
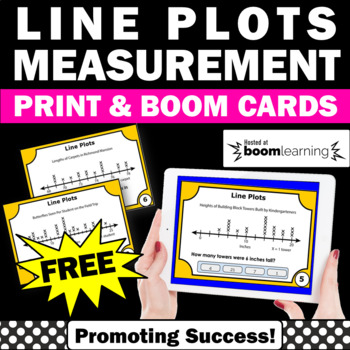
FREE Math BOOM Cards Line Plots Measurement Activities 2nd Grade Math Review
DIGITAL BOOM CARDS AND PRINTABLE PACKET: You will download 6 free task cards (BOOM Learning and print) for your 2nd or 3rd grade students to practice interpreting line plots with whole numbers. You may use the printable task cards in math centers or stations for fun review games and activities, such as a scavenger hunt or SCOOT. They also work well for transition activities, as exit tickets and for morning work, quick formative assessments. Game ideas, a student response form and answer key are
Subjects:
Grades:
2nd - 3rd
Types:
CCSS:
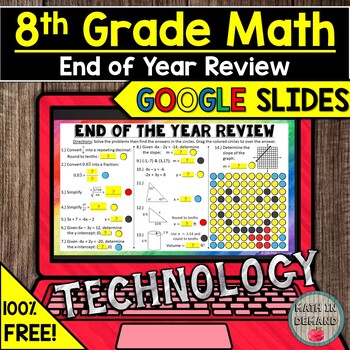
FREE 8th Grade Math End of the Year Review in Google Slides Distance Learning
In this FREE resource, students will be solving various math problems on 8th grade math. Students will drag colored colors according to their answers. This helps with self assessment! A mystery picture will be revealed once they complete the activity. I have embedded a video that shows how to complete the activity and how to upload the student's work.You will be provided with a link that you can distribute to your students through Google Classroom or etc.I also have this same template for FREE
Grades:
8th
Types:
Also included in: DIGITAL MIDDLE SCHOOL MATH GOOGLE SLIDES DISTANCE LEARNING RESOURCES
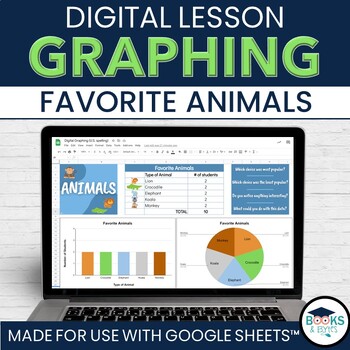
Digital Animal Graphing Data Management Activity for Google Sheets™
Engage your students during a graphing lesson with this Google Sheets™ resource! Simply enter student data about favorite animals...and a bar and circle graph will appear with results automatically! Simple and easy visuals to help students understand graphing and information.Click HERE for a preview video!Looking for more graphs? Check out the bundle!⭐ Digital Graphing Activities Pack for Google Sheets™What is included in this resource:Google Sheets™ file to input student data about favorite ani
Subjects:
Grades:
PreK - 3rd
Types:
Also included in: Graphing Data Management Digital BUNDLE for Google Sheets™
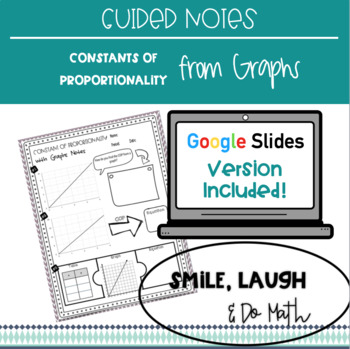
The Constant of Proportionality from Graphs - Guided Notes
These guided notes help students to find the constant of proportionality from graphs as well as translate between formats (equations, tables and graphs). These notes focus on the following skills: Finding the constant of proportionality in graphs Writing an equation from a graph Translating between graphs, equations and tables. What's included: 1 page of guided notes (printable) 1 page of guided notes (digital version on Google Slides) **Note: You will have to first make a copy and then distribu
Grades:
7th - 8th
Types:
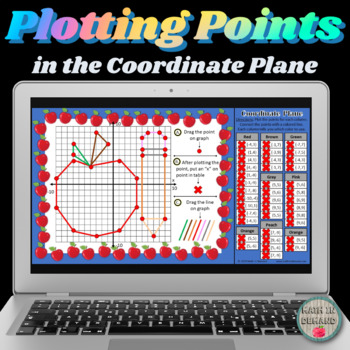
FREE Plotting Points in the Coordinate Plane DIGITAL in Google Slides
This is a FREE DIGITAL resource in Google Slides. Students will be plotting points in the coordinate plane to reveal a mystery picture.Like this activity and want more? Check out my BUNDLE!!!
Grades:
5th - 7th
Types:
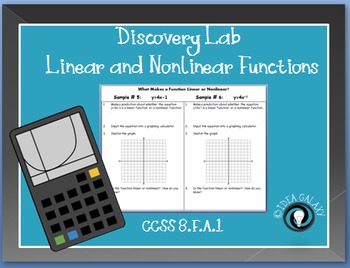
Linear Functions and Nonlinear Functions Discovery Lab
Students will get a great introduction to linear and nonlinear functions in this interactive discovery activity (Supports 8th grade standard CCSS 8.F.A.3 ). Using a graphing tool, students will compare linear and nonlinear functions, drawing their own conclusions on the attributes of each.
***This product is included in the Linear and Nonlinear Functions Games and Activities BUNDLE***
Included in this 13 page download is:
-Teacher directions and tips
-Powerpoint presentation for teachers to
Grades:
7th - 9th
Types:
Also included in: Linear and Nonlinear Functions Activities Bundle
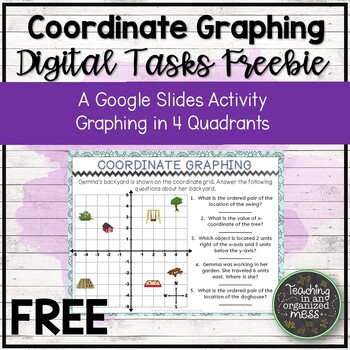
FREE Coordinate Graphing in Four Quadrants Google Slide Activity
Students will answer questions about graphing on the coordinate plane with all four quadrants. There are 2 slides included. You and your students will need to have access to Google Drive in order to access this activity.Instructions are includes on how to assign this activity to students.Customer Tips:How to get TPT credit to use on future purchases:Please go to My Purchases page. Underneath the product name you'll see a Provide Feedback button. Click it and you'll be taken to a page where you c
Grades:
6th
Types:
CCSS:
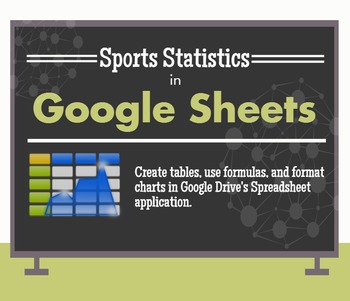
Manage Sports Statistics in Google Drive / Google Sheets - Activity
Use Google Sheets to analyze sports data
This activity lets students practice several fundamental spreadsheet skills, including:
-renaming documents
-adding formulas
-inserting / formatting charts
Screenshots demonstrate how to do all of the above in Google Sheets, the spreadsheet application in the Google Drive suite. You can add additional statistics to customize the assignment for your students and adjust the level of difficulty.
Aligned to the following Massachusetts Technology Literacy
Grades:
5th - 8th
Types:
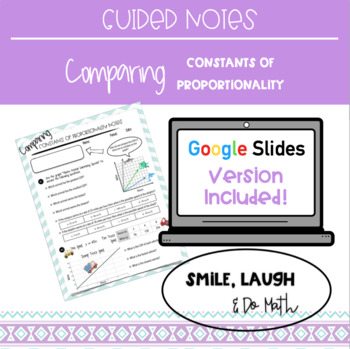
Guided Notes: Comparing the Constants of Proportionality
These guided notes help students to compare constants of proportionality primarily from graphs.These notes focus on the following skills:Determining the largest/smallest constant of proportionality from looking at a line's steepness Finding the constant of proportionality in graphs, equations and tables Answering questions about a graph (such as which is faster or slower) What's included:1 page of guided notes (printable)1 page of guided notes (digital version on Google Slides) **Note: You will
Grades:
6th - 8th
Types:
CCSS:
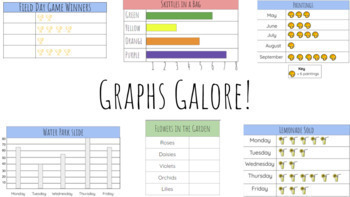
Graphs Galore! DISTANCE LEARNING RESOURCE
Google slides editable assignment! This resource contains 16 practice slides with various types of bar graphs and pictographs with engaging topics & questions. Interactive, easy to use, and perfect to push out to students during this extended closure. Teacher created resource built around 3rd grade mathematics standards. Resource includes:Interactive Bar graph practiceInteractive Pictograph practiceCreating tables that match data presented in graphsTeacher-created questions that go along wit
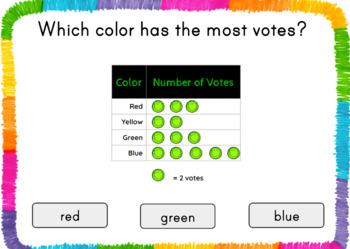
Reading a Pictograph Boom Card™ Preview
This product is a preview of the full set of Boom Cards™ available. Click the link in the PDF to access the first four cards. This product is not hosted on Teachers Pay Teachers, and will take you to another website.These interactive task cards will ask your students to read and interpret pictographs.
Subjects:
Grades:
1st - 3rd
Types:
CCSS:
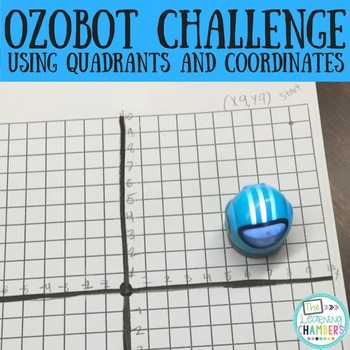
Ozobot STEM Challenge: Quadrants and Coordinates
This ozobot coordinate challenge will help your students review coordinates and quadrants with a fun STEM challenge. Your students will need to use ozoblockly to program their ozobot to stay inside the grid paper. The checklist provided will help challenge your students while they are programming their ozobot. You will need to have ozobots and iPads to complete this challenge.
Included in this freebie is...
- 4 different sized grid paper for easy differentiate
- Challenge Checklist
Want to
Grades:
3rd - 5th
Types:
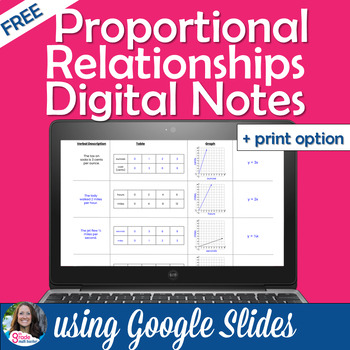
FREE Proportional Relationships Digital Notes Graphic Organizer
This FREE digital graphic organizer uses Google Slides to help students see proportional relationships in multiple representations- by a verbal description, table, graph, and equation. Students will type in text boxes to fill in the blanks and drag a line to complete the graph to show proportional relationships represented various ways. You can even have them highlight the constant of proportionality from each representation. There is also an option to print this notes page.Please follow me! ~ 8
Showing 1-24 of 105 results


