- PDF
- Internet Activities
- Webquests
Description
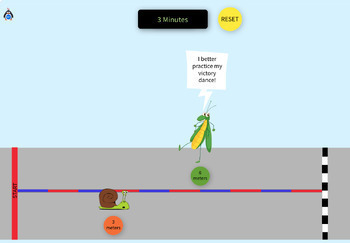
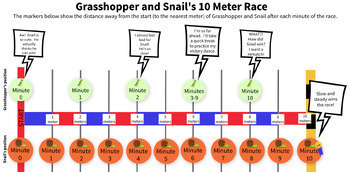
This worksheet compliments the free online Virtual Science Teachers Position vs. Time Graphs: Snail vs. Grasshopper interactive. The provided printable graphic can be used in place of using the online interactive.
Note: Test out the free part of the activity by clicking on this link. Be sure it works in the classroom and is not blocked by your school district.
Students fill out the printed worksheet as they work through the interactive. Please note that the worksheet includes many questions that are not included in the interactive.
Concepts included in the interactive and on the worksheet:
- Recording position and time data into a data table
- Graphing data: Labeling x and y axis, plotting and graphing data
- Analyzing position vs. time graphs
- Displacement and average velocity
- Calculating average velocity
Please visit the VST website to find interactives, games, bell ringers, and more.
If you find this resource valuable, we'd be grateful for a 5-Star review. Your support greatly benefits Virtual Science Teachers, our non-profit organization.
If you have any feedback or questions, please email me!
Thank you!
suzanne@virtualscienceteachers.com


