TPT
Total:
$0.00

Statistics Unit 9 Bundle - Hypothesis Testing (one sample) (18 days)

Rated 5 out of 5, based on 1 reviews
5.0 (1 rating)
;
Mountainworks Education
61 Followers
Grade Levels
10th - 12th, Higher Education
Resource Type
Standards
Formats Included
  • Zip
  • Excel Spreadsheets
Pages
85 pages
$19.50
$19.50
Share this resource
Report this resource to TPT
Mountainworks Education
61 Followers

Description

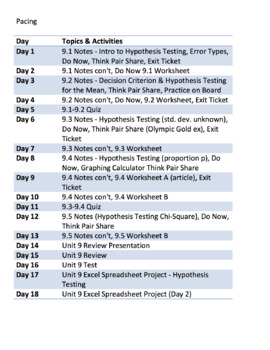
This is a unit plan bundle for a Statistics class. The plans include common core math standards, time frame, activities, enduring understandings, essential questions, and resources used. It is designed to last 18 days, depending on pacing. The plans include:

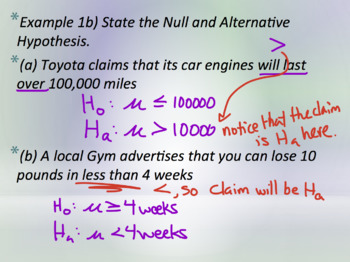
56-slide presentation, with annotated guide for reference

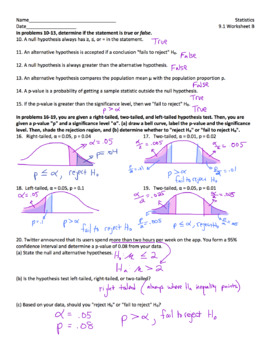
5 Worksheets

1 "Read & Respond" Article Worksheet

2 Quizzes

"Do Now" Entrance problems

Spreadsheet Activity - Hypothesis Testing

Review slides (for peer presentations)

Unit Review

Unit Test

Pacing Guide with administrative unit plan

All with answer keys included

*The topics covered are Hypothesis Testing (μ - σ known and unknown, population proportion p, and variance σ² with Chi-Square statistic χ²), T-distribution, Chi-Square distribution, Null & Alternative Hypotheses, Decision Criterion, P-value ρ & significance level α, quality checking, election results, using graphing calculators, and Spreadsheets. Examples use real-world data such as salaries of professional athletes. The documents are Word based, Powerpoint based, Excel Based, pdfs included, and completely editable. Enjoy!

**If you find this product useful, consider buying "A Mountain of Statistics Curriculum" for the entire class**

***Please read the "readme" text file and End User License Agreement contained in the Product. Thank you for respecting my work***

Total Pages
85 pages
Answer Key
Included
Teaching Duration
1 month
Report this resource to TPT
Reported resources will be reviewed by our team. Report this resource to let us know if this resource violates TPT’s content guidelines.

Standards

to see state-specific standards (only available in the US).
Use the mean and standard deviation of a data set to fit it to a normal distribution and to estimate population percentages. Recognize that there are data sets for which such a procedure is not appropriate. Use calculators, spreadsheets, and tables to estimate areas under the normal curve.
Fit a function to the data; use functions fitted to data to solve problems in the context of the data.
Understand statistics as a process for making inferences about population parameters based on a random sample from that population.
Decide if a specified model is consistent with results from a given data-generating process, e.g., using simulation. For example, a model says a spinning coin falls heads up with probability 0.5. Would a result of 5 tails in a row cause you to question the model?
Use data from a sample survey to estimate a population mean or proportion; develop a margin of error through the use of simulation models for random sampling.

Reviews

Questions & Answers