19 results
Statistics independent work packets for staff
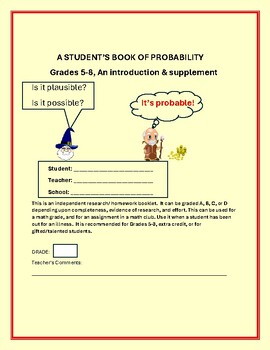
PROBABILITY: A STUDENT'S ACTIVITY/KNOWLEDGE BOOKLET GRADES 5-8, MG, & MATH CLUB
This is an independent activity booklet on probability. It is designed to enhance the learning of this mathematical theory. It has real life applications, a quiz, quotes, mystery quiz, biographies, and a writing prompt, etc. The intent is to show students how math is an integral part of life, and its functions. Answer keys are included. There is an art-design component for 2 activities, as well. This is a beginner-introduction/ supplement to this topic. Excelsior! Thank you ever so much for
Subjects:
Grades:
5th - 8th, Adult Education, Staff
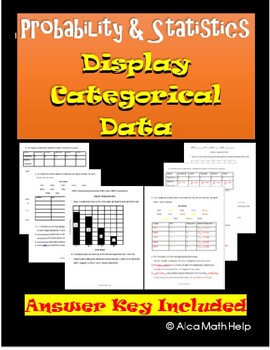
Categorical Data Display Pie Chart & Bar Chart: Worksheet, CW, HW CP & AP Stats
If you are looking for an easy to follow for students. You are at the right place. This is a quick and easy to follow activity sheet that brings across the concept clear and precise. Teachers in my department love this activity sheet. This is useful of CP Probability and Statistics, AP Statistics and Algebra 1 statistics unit. Categorical data and Display Variables ObjectivesAt the end of the lesson students should be able to:1. Correctly define categorical and quantitative data with examples2.
Subjects:
Grades:
8th - 12th, Higher Education, Adult Education, Staff
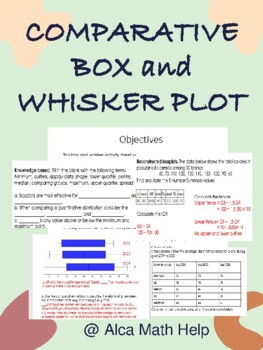
Comparison Box and Whisker Plots Worksheet, Quiz, Test for Stats & AP Stats
This box and whisker activity sheet was designed to test students understanding of the 5 number summary data values given quantitative data sets. Perfect for students in grade 10-12 doing statistics and you want to give them a challenge and should be manageable for students doing AP STATSAt the end of this activity students should be able to1. Students should be able to explain and construct box plots showing the different regions and what they represent. 2. Students should also be able to use
Subjects:
Grades:
11th - 12th, Higher Education, Adult Education, Staff
CCSS:
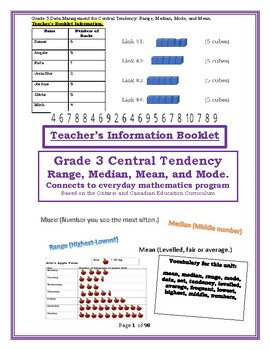
Grade 3 Data Management for Central Tendency: Range, Median, Mode, and Mean.
Grade 3 Unit 13: Data Management for Central Tendency: Range, Median, Mode, and Mean.Please see “Preview” for more information on the complete workbook. Grade 3 Maths Program Based on the Ontario and Canadian Curriculum. 100% connected to the Ontario and Canadian 2022 Curriculum with a rubric.With Connections to EQAO sample questions from 2006 to 2022, to introduce the math language to the grade 3 students. Save time and money on your maths program. No need to copy; stress the
Subjects:
Grades:
3rd, Staff
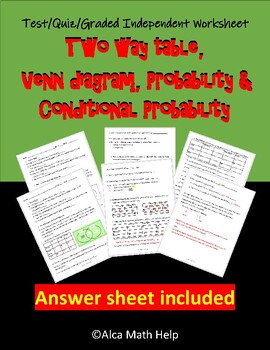
Unit Test/Quiz/Packet- Two-way table, Venn diagram, Conditional Probability
If you are looking for an easy to follow for students. You are at the right place. This is a quick and easy to follow activity sheet that brings across the concept clearly and precisely. Teachers in my department love this activity sheet. This is useful for CP Probability and Statistics, AP Statistics and Algebra 1 statistics unit.5W’s and How of statisticsAt the end of the lesson students should be able to:1. Recall the history of statistics2. Define the 5W’s and How of statistics with example
Subjects:
Grades:
9th - 12th, Higher Education, Adult Education, Staff
CCSS:
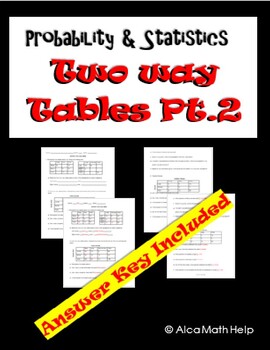
Probability & Statistics- Two-Way Table Worksheet, Homework, Quiz, AP Review
If you are looking for an easy to follow for students. You are at the right place. This is a quick and easy to follow activity sheet that brings across the concept clearly and precisely. Teachers in my department love this activity sheet and the students enjoy it. This is useful for CP Probability and Statistics, AP Statistics and Algebra 1 Statistics unitAt the end of the lesson students should be able to:1. Define two-way tables with its properties.2. Create two- way tables using frequency co
Subjects:
Grades:
9th - 12th, Higher Education, Adult Education, Staff
CCSS:
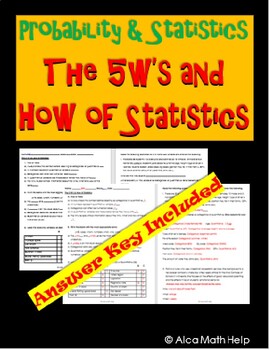
The 5W's & How of Statistics Worksheet, CP Stats, AP Stats, HW, Back-to-School
If you are looking for an easy to follow for students. You are at the right place. This is a quick and easy to follow activity sheet that brings across the concept clearly and precisely. Teachers in my department love this activity sheet. This is useful for CP Probability and Statistics, AP Statistics and Algebra 1 statistics unit.5W’s and How ObjectivesAt the end of the lesson students should be able to:1. Recall the history of statistics2. Define the 5W’s and How of statistics with examples3.
Subjects:
Grades:
8th - 12th, Higher Education, Adult Education, Staff
CCSS:
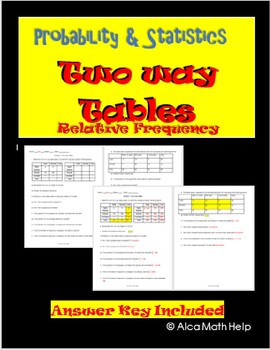
Two-Way Tables Worksheet, Homework, CW, Review, Quiz for CP Stats, AP Stats
If you are looking for an easy to follow for students. You are at the right place. This is a quick and easy to follow activity sheet that brings across the concept clear and precise. Teachers in my department love this activity sheet. This is useful of CP Probability and Statistics, AP Statistics and Algebra 1 statistics unit. Frequency Tables ObjectivesAt the end of the lesson students should be able to:1. Define two-way tables with its properties.2. Create two-way tables using frequency count
Subjects:
Grades:
10th - 12th, Higher Education, Adult Education, Staff
CCSS:
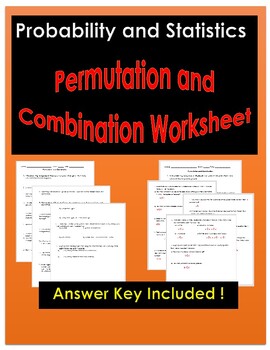
Permutation and Combination Worksheet/Activity/Packet | Alca Math Help
If you are looking for an easy to follow for students. You are at the right place. This is a quick and easy to follow activity sheet that brings across the concept clearly and precisely. Teachers in my department love this activity sheet. This is useful for CP Probability and Statistics, AP Statistics and Algebra 1 statistics unit.Objectives1. Recognize the difference between permutation and combination.2. Use the fundamental counting principle: or/and.3. Correctly use both formula either by ha
Subjects:
Grades:
9th - 12th, Higher Education, Adult Education, Staff
CCSS:
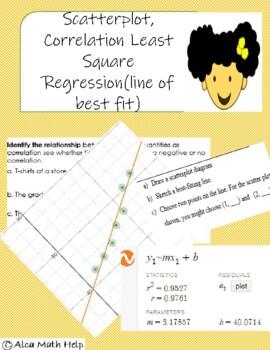
Scatterplot, Correlation and Least Square Regression (line of best fit)
At the end of this activity Students will be able to:1.Calculate the slope of a using points from the line of best fit.2.Estimate the strength and relationship between variables using a scatterplot.3.Explain correlation given the correlation coefficient4.Know facts about correlation●Answer Key included!●This activity sheet can be used as a Unit Quiz, Classwork or HomeworkIt comprises of short answer and true or false optionsPlease follow me by clicking this link
Subjects:
Grades:
11th - 12th, Higher Education, Staff
CCSS:
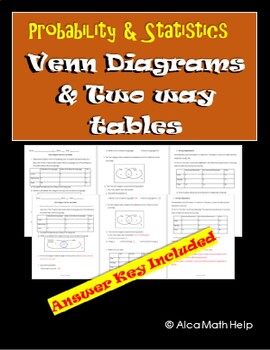
Venn Diagrams and Two-way table Worksheet CP Probs, Homework
If you are looking for an easy to follow for students. You are at the right place. This is a quick and easy to follow activity sheet that brings across the concept clearly and precisely. Teachers in my department love this activity sheet. This is useful for CP Probability and Statistics, AP Statistics and Algebra 1 statistics unit-Venn diagram ObjectivesAt the end of the lesson students should be able to:1. Identify a Venn diagram and its properties2. Shade specific regions of the Venn diagram(
Subjects:
Grades:
8th - 12th, Higher Education, Adult Education, Staff
CCSS:
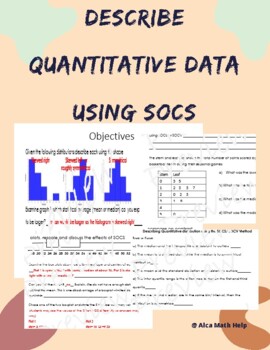
Describe Quantitative Data using SOCS/SOCV- Box plot, Histogram, Stem plot
If you are looking for a worksheet that can be used as a quiz, test, review packet you are at the right place. This activity sheet is suitable for students doing AP Stats and CP Probability and Statistics. This activity sheet allows students to:Use prior knowledge to answer true false questions and fill in the blanks with vocabulary provided.Describe box plots, histogram and stem plot using SOCS.Interpret the shape, center, outlier or any unusual feature along with the spread.
Subjects:
Grades:
11th - 12th, Higher Education, Adult Education, Staff
CCSS:
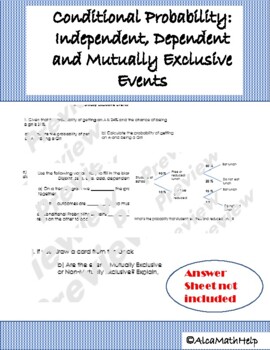
Conditional Probability: Independent, Dependent and Mutually Exclusive Events
If you are looking for an assessment piece that is suitable for classwork, pop quiz, quiz, mini test, or homework. you have the right piece. If you want students to work together independently, in pairs or small group this activity is also appropriate. Students should have knowledge of* How to calculate probability* Sample space/ equally likely outcome* Venn diagram and their parts (union, intersection, Only, neither) At the ed of the lesson activity students will be able to:a) examine and comp
Subjects:
Grades:
10th - 12th, Higher Education, Adult Education, Staff
CCSS:
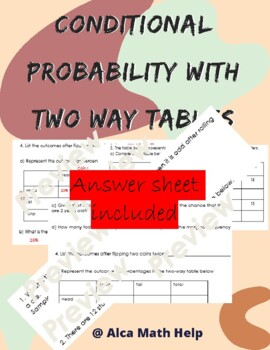
Conditional Probability and Two-way tables AP Stats/ CP Probability and Stats
This activity is design as a practice sheet: classwork or homework or mini quiz. It aims to extend students understanding of probability by teaching the students about conditional probability with two-way tables. Students can work collaboratively or independently.This can also be utilized by students doing AP STAT as bell work pop quiz or any assessment you decide.Feel free to follow me at https://www.teacherspayteachers.com/Sellers-Im-Following/Add/Alca-Math-Help so you can know when the free p
Subjects:
Grades:
10th - 12th, Higher Education, Adult Education, Staff
CCSS:
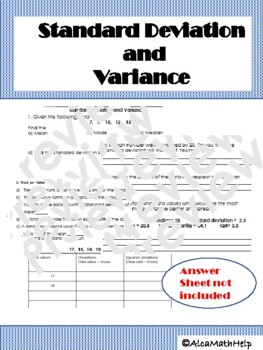
Standard Deviation and Variance AP Stats, CP probability and Statistics
If you are looking for an activity sheet that will help students to practice standard deviation and variance both by hand and the table. This is the activity you are looking for. Not too complex but requires some level of thinking.Objectives:1. Students should be able to interpret the relationship between the mean and standard deviation. 2. Students should know how the change in variables affects the spread and center. 3.Students will be able to complete a knowledge-based section by answering tr
Subjects:
Grades:
10th - 12th, Higher Education, Adult Education, Staff
CCSS:
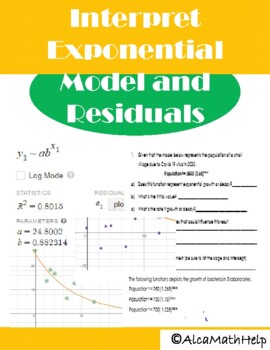
Exponential Regression Model AP Stats/ CP Probability and Statistics/ Algebra 2
This activity will engage students to explore the Exponential Function/ModelAt the end of this lesson students will be able to1. Identify independent and dependent variables2. Make predictions of a model and use calculations to prove this3. Interpret Exponential Regression Model with respect to the slope and initial value.4. Examine exponential function and tell if it’s a growth or decay based on the shape of the graph5. Write equations in exponential form given the initial value and the rate (g
Subjects:
Grades:
10th - 12th, Higher Education, Adult Education, Staff
CCSS:
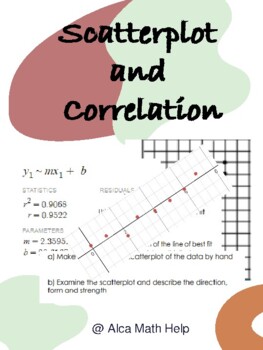
Scatterplot and Correlation Pop Quiz, Homework, Exit Slip
This activity will test students' knowledge of line of best fit, linear equation, residual, linear model, predicted values. There is not answer sheet provided. If you want this leave me a comment and i will create a video with solution on my YouTube or Facebook account @Alcamathhelp
Subjects:
Grades:
10th - 12th, Higher Education, Adult Education, Staff
CCSS:
Binomial Probability Model AP Statistics/CP Probability and Statistics
Binomial Probability modelIf you are looking for simple yet challenging and straightforward activity to test a few objectives with your students. You are at the right place.This activity sheet has both knowledge based where the students fill in the blanks and complete true and false section. There are also real-life scenarios where they will use the formula to see how probabilities change as they control the probability of sucess and the number of trials. Objectives:1. Students should have knowl
Subjects:
Grades:
11th - 12th, Higher Education, Adult Education, Staff
CCSS:
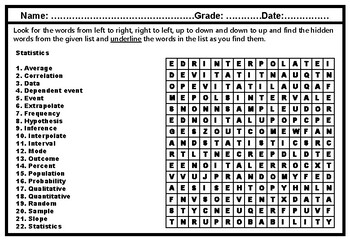
Statistics, Word Search Worksheet
Statistics, Word Search Worksheet has 1 wordsearch with 22 words.Words are from left to right, right to left, upto down and down to up in the wordsearches.Children across all age groups just love wordsearch challenges. Excellent revision tool,learning spellings, and useful for Earlyfinishers, Homework packet, Sponge activityand Sub plans.May be used for continued activitiesaccording to the teacher.
Subjects:
Grades:
4th - 12th, Staff
Showing 1-19 of 19 results


