460 results
Statistics independent work packets by TpT sellers for TpT sellers
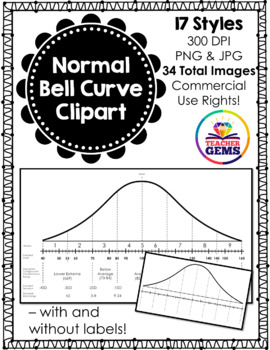
Normal Bell Curve (Normal Distribution) Clipart
Normal Bell Curve (Normal Distribution) Clipart: This Normal Bell Curve (Normal Distribution) clipart set includes 17 distinct styles (6 blank styles and 11 styles with scores) that come in both PNG (transparent) and JPEG (white background) for a total of 34 images. All image files are 300dpi. Commercial use is allowed with proper credit given (see my Terms of Use in the download – or read prior here). Below is a breakdown of all the images included in this product.Normal Bell Curve (NBC) Table
Subjects:
Grades:
Not Grade Specific
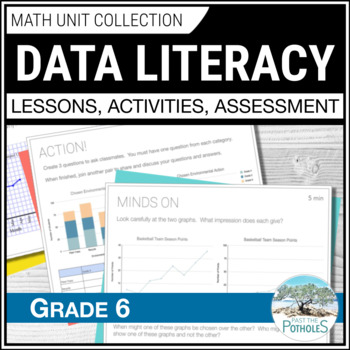
Data Management Unit: Reading Graphs Collecting & Analyzing Data Grade 6 Ontario
Save time and reduce stress!! This UPDATED Grade 6 Ontario Math Data Literacy unit has EVERYTHING YOU NEED. Students will learn about reading graphs, collecting data, analyzing data, misleading graphs, averages, and more. It includes 3-part Google Slides lessons, worksheets, games, centres, assessments, and report card comments. New histograms, broken-line graphs and infographic content are included with data analysis and data collection! SPECIFIC LESSON TOPICS:✓ Discrete and Continuous Data✓
Subjects:
Grades:
5th - 7th
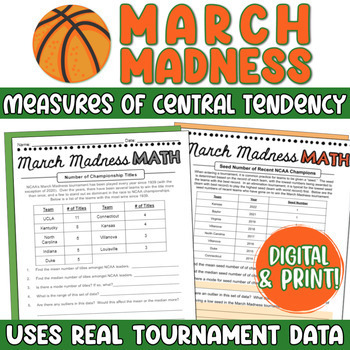
March Madness Math Mean, Median, Mode - Measures of Central Tendency Activity
This March Madness math activity asks students to determine mean, median, mode, and range for a variety of actual statistics from previous NCAA March Madness basketball tournaments. Perfect to excite any sports enthusiasts! It includes both print and digital formats, perfect for Google Classroom.Each page slide within the activity is dedicated to a different statistic (for example, years since previous championships amongst winners, regular season wins amongst Elite 8 teams, Seeds of Champions
Subjects:
Grades:
6th - 8th
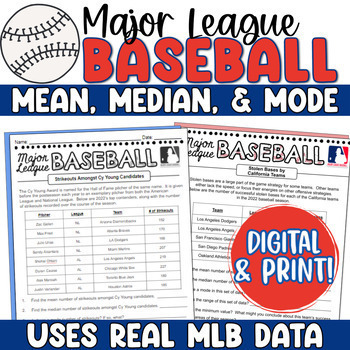
Baseball Math Mean, Median, Mode - MLB Baseball Measures of Central Tendency
This real-world baseball math statistics project asks students to determine mean, median, mode, and range for a variety of actual statistics from the 2023 Major League Baseball season. Perfect to excite any sports enthusiasts! It includes both a traditional print option and a digital version, made for Google for any 1:1 classrooms!Each slide within the activity is dedicated to a different statistic (for example, strikeouts amongst Cy Young candidates, or homeruns amongst MVP candidates). Stud
Subjects:
Grades:
6th - 9th
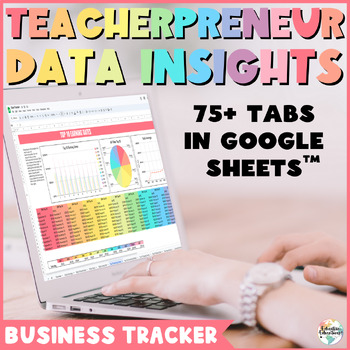
Teacherpreneur Data Insights - TPT Seller Business Tracker Analysis Spreadsheets
Welcome to Teacherpreneur Data Insights – a business data tracker designed to elevate your teacher seller journey. Gain actionable insights, track trends, and optimize your strategies with this comprehensive tool. In a world where data is powerful, this guidebook and Google Sheets combo empowers you to navigate your TPT store effectively. Seamlessly analyze your metrics, make informed decisions, and propel your store to new heights. Utilize this powerful tool to identify your best-selling produc
Subjects:
Grades:
Not Grade Specific
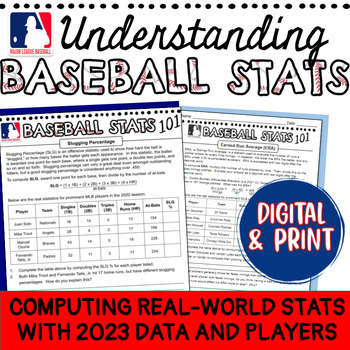
Understanding Baseball Stats MLB Math Sports Statistics Activity Digital & Print
This math baseball statistics activity is perfect for engaging your sports enthusiasts! It includes a Google Slides activity in which students explore and compute different baseball statistics using real numbers from the 2023 season, as well as the traditional print version. Students will enjoy seeing players they know and the real-life stats, and the higher order thinking questions will have them making connections in no time!This activity is great for enrichment, during baseball season, or fo
Subjects:
Grades:
7th - 10th
Types:
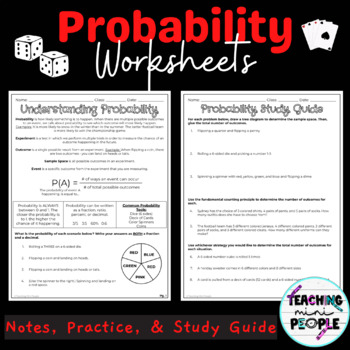
7th Grade Probability Worksheets
In this Percentage Worksheet Set, students learn and practice with probability. There are notes and practice problems on each probability topic, as well as a 32 question study guide for practice. Students work with experimental and theoretical probability, compound events, tree diagrams, and so much more. This set is perfect for in class notes, math centers, remediation, sub plans, or extra credit. What’s Included:➜ 10 Worksheets of Notes & Practice➜ 3 Page Study GuideTopics Included:➜ Under
Subjects:
Grades:
6th - 7th
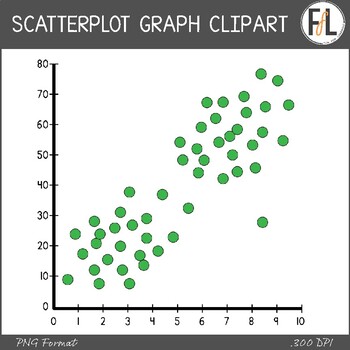
Statistics Clipart - SCATTERPLOT GRAPHS
Need some clipart for your secondary grades statistics product? This graphics resource features 7 different scatterplot graphs in a variety of different options that are perfect for making worksheets, interactive notebook elements, interactive whiteboard activities and more! The graphs all come in the following options:2) labeled or unlabeled 3) color, grayscale, or blacklineThe following distribution types are represented by at least one of the graphs:- positive correlation- negative correlat
Subjects:
Grades:
Not Grade Specific
Also included in: Statistics Clipart - Graphs, Secondary Grades - BUNDLE
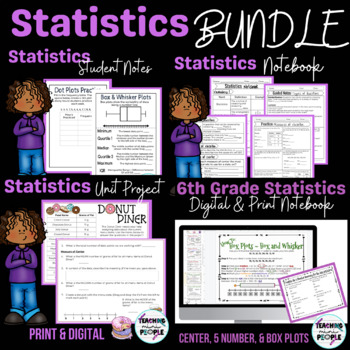
6th Grade Statistics | Measure of Center | Box Plots | 5 Number Summary
This Statistics Bundle is perfect for 6th graders who are learning about statistics. There are notes for you to teach your lesson with (anchor charts), a notebook set with guided practice and practice problems for each topic, vocabulary for each topic, digital or print practice with measure of center and box plots, and a unit project for the end to wrap it up. The digital notebook was recently added, by request! Statistics Notebook/Worksheets Include:➜ Statistics Vocabulary➜ Statistical Question
Subjects:
Grades:
5th - 7th
2024 Solar Eclipse Math - A Bank of 90 Math Problems About the Solar Eclipse
Combining math and science is a natural. With all the excitement surrounding the 2024 total solar eclipse, it only makes sense to extend our math knowledge and skills to the numbers involved with the incredible show that is about to take place in the sky. This resource contains a Bank of Math Problems for the 2024 Total Solar Eclipse. It includes 90 math problems (and answers) that involve the following skills: - Identifying the least and greatest values - Ordering numbers from least to greate
Subjects:
Grades:
4th - 7th
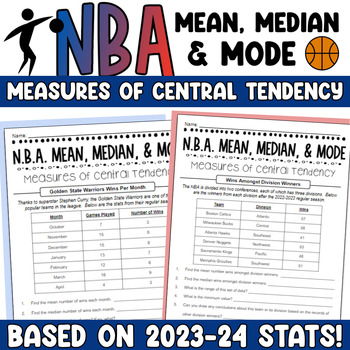
NBA Mean Median and Mode - Basketball Math Measures of Central Tendency
This NBA Measures of Central Tendency is perfect for your sports fans and just in time for basketball season or NBA Finals! Students find mean, median, mode, and range of real basketball stats from the 2023-2024 season. Statistics include number of wins, number of 3-point shots, number of blocks, points scored, and more!This resource can be used in a variety of ways, including whole-group instruction, small-groups, or independent work. It could also be broken into smaller parts and used for b
Subjects:
Grades:
6th - 8th
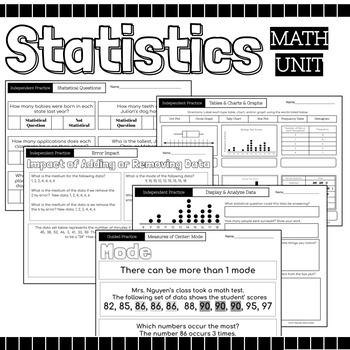
Statistics Math Packet {Data, Charts, Graphs, Mean, Median, Mode, Range, Spread}
52 Page Statics Unit Includes: Guided Instruction & Independent Practice Pages Usage Suggestions and IdeasThis resource can be utilized in numerous ways, here are some ideas:use for guided practiceassign as partner workassign as independent practicecan be used for morning workuse for reteaching in small group settinguse as review prior to assessmentuse as review in continuing to strengthen skillassign for homeworkuse as independent work during math centersTopicsRecognize Statistical Question
Subjects:
Grades:
4th - 12th
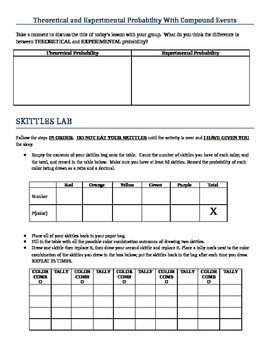
Activity for Theoretical and Experimental Probability of Compound Events
This Skittles Lab is a fun and engaging way to get students excited about finding probabilities. The experiment involves finding the theoretical and experimental probability of choosing a specific order of skittles from a bag. Students work best in groups of three to calculate their probabilities and reflect on their results. This extends what students learned about Single Event Probabilities and now involves a Compound Event. There are step-by-step instructions for students to follow through ou
Subjects:
Grades:
7th
CCSS:
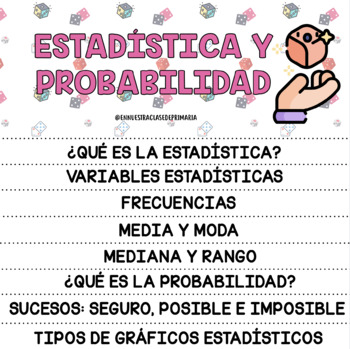
FLIPBOOK ESTADÍSTICA Y PROBABILIDAD
FLIPBOOK para trabajar los siguientes contenidos: ¿Qué es la estadística?Variables estadísticas.Frecuencias,Media y modaMediana y rango¿Qué es la probabilidad?Sucesos: seguro, posible e imposible. Tipos de gráficos.
Subjects:
Grades:
5th - 8th
Statistics Clipart - Graphs, Secondary Grades - BUNDLE
Need some graph clipart for your secondary grades statistics product? This clipart bundle includes 5 different clipart sets. You save 30% by buying them together.The graphs in each product come in a variety of options that make them perfect for making worksheets, assessments, interactive notebook activities, and interactive white board files!Options:1) labeled or unlabeled2) color/grayscale/blackline)These graphs, like ALL my clipart, can be used as moveable pieces in digital resources. No ad
Subjects:
Grades:
Not Grade Specific
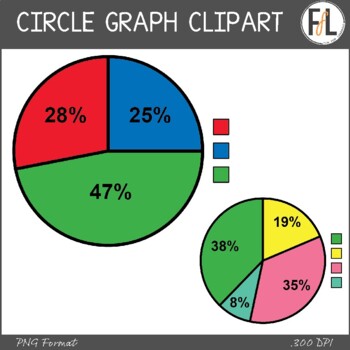
Statistics Clipart - CIRCLE GRAPHS
Need some clipart for your secondary grades statistics product? This graphics resource features 8 different circle graphs (aka: pie charts) in a variety of different options that are perfect for making worksheets, interactive notebook elements, interactive whiteboard activities and more! The graphs all have an unlabeled color key, and come in the following options:2) labeled (with numerical percentages) or unlabeled 3) color, grayscale, or blacklineThese graphs, like ALL my clipart, can be use
Subjects:
Grades:
Not Grade Specific
Also included in: Statistics Clipart - Graphs, Secondary Grades - BUNDLE
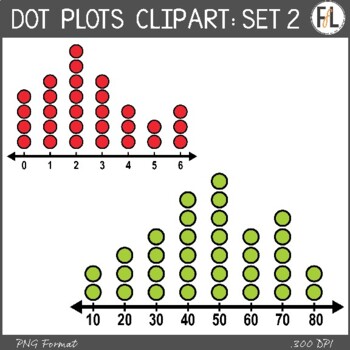
Statistics Clipart - DOT PLOTS, SET 2
Need some MORE clipart for your secondary grades statistics product? This graphics resource features 8 different dot plot graphs in a variety of different options that are perfect for making worksheets, interactive notebook elements, interactive whiteboard activities and more! This second set is designed to be a bit easier than the 1st set. The graphs all come in the following options:2) labeled or unlabeled 3) color, grayscale, or blacklineThe following distribution types are represented by
Subjects:
Grades:
Not Grade Specific
Also included in: Statistics Clipart - Graphs, Secondary Grades - BUNDLE
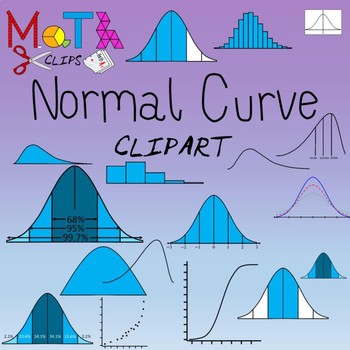
Normal Distribution Statistics Clipart
A collection of 90 images of normal curves (bell curves), labeled subdivided by standard deviation. Includes shaded distributions by standard deviation sections. Also includes examples of other skewed distributions, symmetric distributions, binomial distributions, t-distribution, chi-square. Includes cumulative distribution and probability plots for normal, negatively skewed and positively skewed distributions. Ideal for creating resources for normal distribution and empirical rule concepts
Subjects:
Grades:
Not Grade Specific
PROBABILITY: A STUDENT'S ACTIVITY/KNOWLEDGE BOOKLET GRADES 5-8, MG, & MATH CLUB
This is an independent activity booklet on probability. It is designed to enhance the learning of this mathematical theory. It has real life applications, a quiz, quotes, mystery quiz, biographies, and a writing prompt, etc. The intent is to show students how math is an integral part of life, and its functions. Answer keys are included. There is an art-design component for 2 activities, as well. This is a beginner-introduction/ supplement to this topic. Excelsior! Thank you ever so much for
Subjects:
Grades:
5th - 8th, Adult Education, Staff
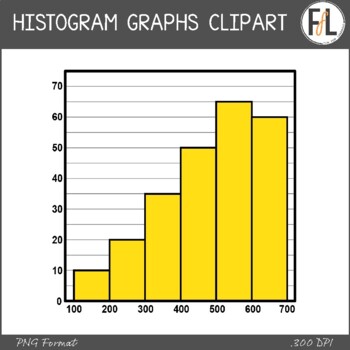
Statistics Clipart - HISTOGRAM GRAPHS
Need some clipart for your secondary grades statistics product? This graphics resource features 8 different histogram graphs in a variety of different options that are perfect for making worksheets, interactive notebook elements, interactive whiteboard activities and more! The graphs all come in the following options:1) labeled or unlabeled2) transparent background or whitefilled 3) color, grayscale, or blacklineThe following distribution types are represented by at least one of the graphs:- p
Subjects:
Grades:
Not Grade Specific
Also included in: Statistics Clipart - Graphs, Secondary Grades - BUNDLE
Mean as a Balance Point for Google Classroom
This resource was designed for distance learning! It is completely editable and is so easy to assign in Google Classroom. This resource reviews the concept of mean and introduces the process of using a frequency line graph to calculate balance point. Be sure to make a copy for each student when assigning in Google Classroom!
Subjects:
Grades:
4th - 7th
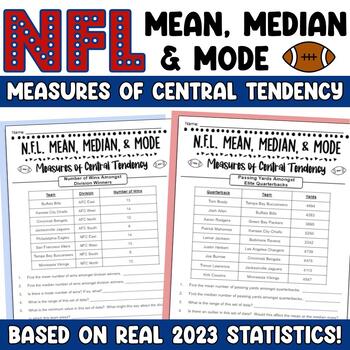
NFL Football Mean Median and Mode Real-World Sports Statistics Central Tendency
This Football Measures of Central Tendency is perfect for your sports fans and just in time for NFL playoffs and Super Bowl season! Students find mean, median, mode, and range of real football stats from the 2023 season. Statistics include number of wins, rushing yards, passing yards, field goal kicks, and number of touchdowns on the season. Higher order thinking questions are included for each topic.This resource can be used in a variety of ways, including whole-group instruction, small-grou
Subjects:
Grades:
6th - 8th
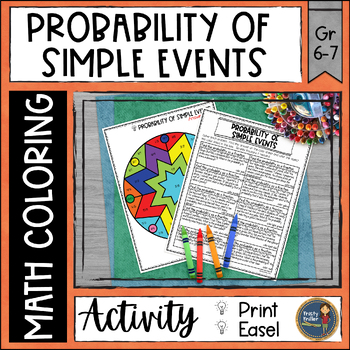
Probability of Simple Events Math Color by Number
This fun math coloring page is all about finding the probability of simple events! Students can work on finding the probabilities of the events and use the code to color in the picture. Math color sheets are perfect for keeping early finishers engaged, as well as for review and homework.What's Included:✓ 1 sheet of problems (10 probability of simple events problems)✓ 1 color page✓ answer keyThis resource is great for:✧ Math Centers, Math Stations✧ At Home Learning, Homework✧ Skill Practice or Re
Subjects:
Grades:
6th - 7th
CCSS:
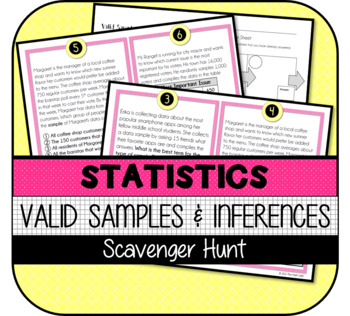
Valid Samples & Inferences SCAVENGER HUNT
This resource contains the following items:1) 20 Printable Scavenger Hunt Cards 2) Printable Student Answer Sheet3) Answer KeyThis resource was developed to meet the requirements of the 7th Grade Statistics & Probability Standards below:CCSS.MATH.CONTENT.7.SP.A.1 Understand that statistics can be used to gain information about a population by examining a sample of the population; generalizations about a population from a sample are valid only if the sample is representative of that populatio
Subjects:
Grades:
7th
Also included in: 7th Grade Math STATISTICS UNIT BUNDLE
Showing 1-24 of 460 results


