35 results
Statistics centers for staff
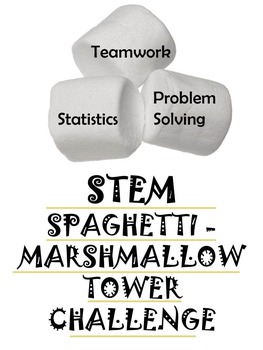
BACK TO SCHOOL STEM ACTIVITY: Spaghetti Marshmallow Challenge
Don't miss out on this wonderful opportunity for your students to work collaboratively, problem-solve, show creativity and use their math skills! This Spaghetti Marshmallow Challenge cost me less than $2.00 for all supplies but delivers such a big bang for the buck! Fun for students K-12 (they say that the kindergarteners actually build the highest!). Enjoy!
Subjects:
Grades:
PreK - 12th, Higher Education, Adult Education, Staff
Types:
Data Analysis Statistics and Probability worksheets (63 Problems) (SAT Review)
Data analysis statistics and probability worksheets ,63 problemsSAT ReviewFraction and Data (29 Multiple choice questions)Statistic Problem (15 questions)Probability Word Problems This section contains 19 word problems about :Simple ProbabilityCounting PrincipleIndependent ProbabilityDependent ProbabilityMutually Exclusive EventsPermutationsCombinationsConditional Probability* AlSO AVAILABLE FOR YOU OR A COLLEAGUE! - CLICK ANY LINK YOU WANT:Number and Operations (SAT Review) Algebra & Functi
Subjects:
Grades:
7th - 12th, Higher Education, Adult Education, Staff
Types:
Permutations and Factorial Notation Worksheet (17 Questions)
Permutations and Factorial Notation Worksheet17 Questions with the solutions1 page for the questions1 page for the answers* AlSO AVAILABLE FOR YOU OR A COLLEAGUE! - CLICK ANY LINK YOU WANT:Probability & OddsMean, median, mode, range, line plot, and Box and whisker WorksheetStatistical Math (GED REVIEW)The Binomial Theorem Worksheet (10Q)Theoretical Probability WorksheetProbability Word Problems (Worksheet) You may also be interested in my other top-selling products: EQUIVALENT FRACTIONS (33
Subjects:
Grades:
9th - 12th, Higher Education, Adult Education, Staff
Types:
Mean - Median - Mode - Range -Understanding With Easy Steps!!!!
This power point presentation is prepared on statistical terms like mean, median, mode, and range. These terms describe properties of statistical distributions. In statistics, a distribution is the set of all possible values for terms that represent defined events.
The presentation is prepared in a very simple language with clear and simple example so that students of grades 3-4-5-6 can understand the concept smoothly. Easy steps for calculating the above terms will help students a lot in remov
Subjects:
Grades:
4th - 8th, Staff
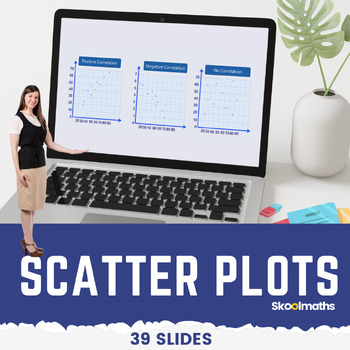
Eight Grade Scatter Plots Digital Math Lesson and Activities CCSS 8.SP.A.1
Eight Grade Scatter Plots Digital Math Lesson and ActivitiesTeach your high school grade how to use and interpret scatter graphs; recognize correlation; draw and use lines of best fit to make predictions?In this lesson, learners will be able to:use and interpret scatter graphs of bivariate data;recognize different types of correlation;draw estimated lines of best fit; anduse lines of best fit to make predictions.
Subjects:
Grades:
8th - 10th, Staff
Types:
CCSS:
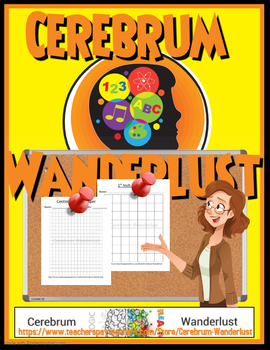
Centimeter & 1 Inch Grid Papers (Full Sheets Each)
A full sheet of Centimeter Grid Paper and a full sheet of 1 inch Grid Paper all contained in one easy to transport/store .pdf. You can use these sheets with making charts, plotting points, etc... Enjoy and thank you for your support.
Subjects:
Grades:
PreK - 12th, Higher Education, Adult Education, Staff
Types:
Box and Whisker Plots Smartboard Slides Lesson Step by Step How to Constuct
Math Teachers ~ You'll LOVE this GREAT Smartboard-Slides-LESSON that teaches students step-by-step how to construct a Box-and-Whisker-Plot; Least/Greatest Value, Lower/Upper Quartile, Median, and how to Find the Interquartile and Range. 37 slides in all! Your students will LOVE this smartboard lesson. WARNING: You MUST have SMART Technologies SMART software, and a SMARTBOARD to teach from, to effectively download, open and use this Interactive Smartboard Lesson. Go to https://legacy.smarttech.co
Subjects:
Grades:
5th - 8th, Staff
Also included in: Box & Whisker Plots Smartboard Slides Notes Worksheet BUNDLE
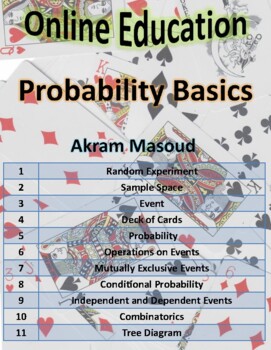
Probability Basics
This resource is a free small notebook for teaching the basics of the probabilities for high school and colleges. The resource is a PDF of nine pages and contains 11 different subjects supported by figures and solved examples. The subjects are:Random Experiment.Sample Space.Event.Deck of Cards.Probability.Operations on Events.Mutually Exclusive Events.Conditional Probability.Independent and Dependent Events.Combinatorics.Tree Diagram.If required, I am entirely ready to prepare a low price comple
Subjects:
Grades:
11th - 12th, Higher Education, Adult Education, Staff
Types:
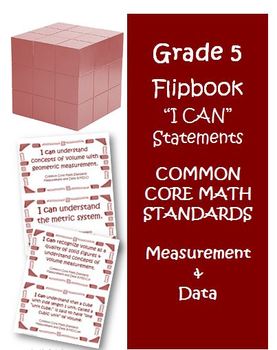
Fifth Grade Math Common Core Measurement and Data I Can Cards
Fifth Grade Math Common Core Measurement and Data I Can Cards
If you are a fifth grade teacher this is a must have for your Common Core classroom. These cards are intended to help your students understand the main focus of your Common Core math lesson. We have the cards printed off on heavier card stock, cut in half, and then bound together with a metal ring clip. That way, we can easily flip to the appropriate standard card and display on a document camera during the lesson. We also have stud
Subjects:
Grades:
5th, Staff
Types:
Also included in: Fifth Grade Math Common Core Super Bundle I Can Statements and Resources
Dot Plots and Data Distribution Displays Smartboard Slides Lesson
Dot-Plots and Data-Distribution Smartboard-Slides-Lesson covers Data-Distribution and Creating Dot-Plots. Lots of practice problems provided. You'll love using this Smartboard Lesson to teach from year after year! WARNING: You MUST have SMART Technologies SMART software, and a SMARTBOARD to teach from, to effectively download, open and use this Interactive Smartboard Lesson. Go to https://legacy.smarttech.com/en/products/education-software/smart-learning-suite/download/trial to download a free t
Subjects:
Grades:
4th - 7th, Staff
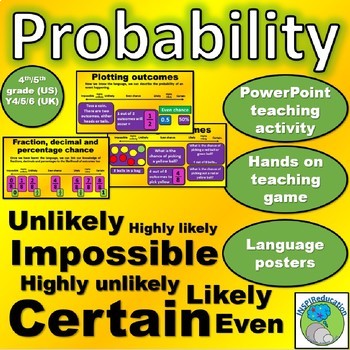
MATH Probability Teaching Activity Bundle: Teaching PPT, language cards, game
This resource has been put together in order to support the class teacher to introduce, teach and embed the language, knowledge and skills of Probability.There are three elements to this bundle (which can be purchased separately through this store):Powerpoint Lead off teaching session:Comprising of 21 teaching slides, this presentation takes the children on a full journey from the very first introduction of the topic of Probability through to solving complex probability problems. Key skills taug
Subjects:
Grades:
4th - 7th, Staff

Statistical Math (GED REVIEW)
Statistical Math
Data analysis statistics and probability worksheets ,63 problems
GED Review
Fraction and Data (29 Multiple choice questions)
Statistic Problem (15 questions)
Probability Word Problems
This section contains 19 word problems about :
Simple Probability
Counting Principle
Independent Probability
Dependent Probability
Mutually Exclusive Events
Permutations
Combinations
Conditional Probability
* AlSO AVAILABLE FOR YOU OR A COLLEAGUE! - CLICK ANY LINK YOU WANT:
Geometry (GED R
Subjects:
Grades:
9th - 12th, Higher Education, Adult Education, Staff
Types:
Math Common Core Measurement and Data Grades 3-5 Vocabulary Cards
Math Common Core Measurement and Data Vocabulary Cards
If you are a third through fifth grade teacher this is a must have for your Common Core classroom. These cards are intended to help your students understand the vocabulary associated with Measurement and Data. We have the cards printed off on heavier card stock, cut in half, and then bound together with a metal ring clip. That way, we can easily flip to the appropriate vocabulary card and display on a document camera during the lesson. The
Subjects:
Grades:
3rd - 5th, Staff
Types:
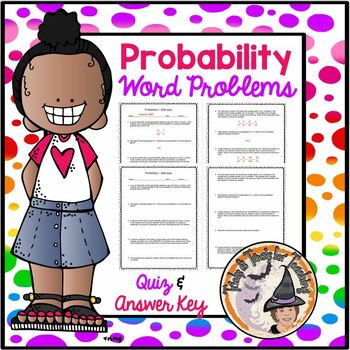
Probability Word Problems Worksheet Odds Quiz and Answer Key
Math Teachers ~ You'll LOVE this FANTASTIC Probability-Odds Word-Problems-Quiz that has word-problems is great for finding out what your students' have learned about probability-and-odds. 2 page worksheet + 2 page Answer KEY included. You'll love using this year after year!IF YOU WOULD LIKE THE VERSION THAT INCLUDES DIGITAL CLICK HERE:https://www.teacherspayteachers.com/Product/DIGITAL-Probability-Word-Problems-Math-Worksheet-Odds-Quiz-and-Answer-Key-7726820Be sure to L@@K at my other 1,285+ TER
Subjects:
Grades:
5th - 7th, Staff
Types:
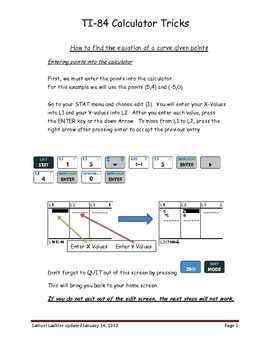
Regressions using the TI84 graphing calculator
Some questions in algebra and algebra 2 will ask for the equation of a curve or correlation coefficient. The r-value number describes both how well the equation of the curve fits and whether the graph is increasing or decreasing. The r- value will be positive if the graph is increasing and the r-value will be negative if the graph is decreasing. The closer the absolute value of r is to 1, the better the curve fits the data. An r-value of 1 means the curve fits the data perfectly and has a positi
Subjects:
Grades:
8th - 12th, Higher Education, Adult Education, Staff
Types:
Visual Probability
Use Visual Probability to compute and graph probability density function values, cumulative distribution function values, quantile values, means and variances of ten more distributions.
Subjects:
Grades:
Higher Education, Adult Education, Staff
Types:
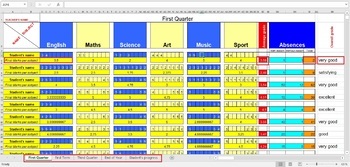
Calculate Student's Final Marks ( Grades ) in excel
If you want to easily calculate student's marks this excel document is great solution. I added all excel's necesarily formulas to make this important task so easier.When you add the marks for every subject, it's final mark will be automatically calculated. At the same time average grade will also be calculated and updated.There is also section for absences (excused and unexcused) which will also be calculated.At the end, if student's Overall grade is equal or above 4.5, it will be automaticaly w
Subjects:
Grades:
PreK - 12th, Higher Education, Adult Education, Staff
Types:
Median Mode Range Smartboard Slides Lesson Measures of Central Tendency
Incredible ~ 31 slides ~ Smartboard-Slides-Math-Lesson over Median, Mode, and Range (Measures of Central Tendency). This is EVERYTHING you need to teach these three measure-of-central-tendencies. Students will enjoy the interactive slides where they work problems at the Smartboard. Please be sure to see my other smartboard lesson on Finding the Mean, Average. You'll enjoy using this resource year after year. WARNING: You MUST have SMART Technologies SMART software, and a SMARTBOARD to teach from
Subjects:
Grades:
4th - 7th, Staff
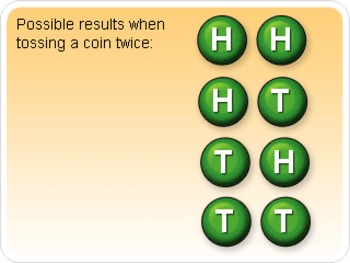
Compound Events Worksheet (10 Q)
Compound Events Worksheet
10 word problems worksheet
Subjects:
Grades:
3rd - 12th, Higher Education, Adult Education, Staff
Types:
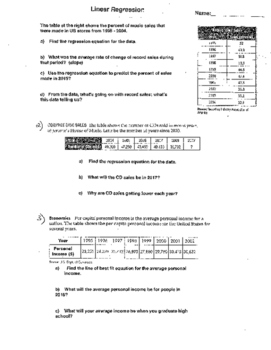
Linear Regression Line of Best Fit Regression Function Regression Equation Quiz
This is all you need to teach and have students learn Linear Regression/Regression Function/Equation. The first worksheet is a double sided worksheet that covers real world linear regression. I researched real world data and created problems that students will be interested in, rather than boring data from the textbooks. A TI-83 graphing calculator should be used, but this can be done without a graphing calculator.
The second worksheet is a single sided review worksheet that also has Liter
Subjects:
Grades:
9th - 12th, Higher Education, Adult Education, Staff
Types:
PROBABILITY: A CHILD'S INTRODUCTORY BOOKLET, GRADES 4-8
This is an introduction to probability. There is a part which focuses on the history of probability, and its development by two famous mathematicians. There are a few simple problems to work out. There is a famous quote to figure out who said it!Thanks ever so much for visiting! A small answer key is provided. Math is exciting!
Subjects:
Grades:
4th - 8th, Staff
Types:
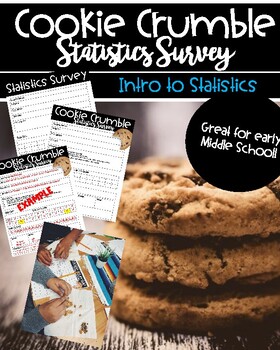
Statistics Survey-Cookie Crumble
Chocolate chip cookies aren't just a favorite after-school snack. They're also a rich source of statistical data! Kick off your Statistics Unit with some Chips Ahoy! For this activity you will need a chocolate chip cookie (any brand works) for each student or pair of students. Each student crumbles up a cookie and counts the number of whole chips. Students then collect the data from their classmates and use the data set to find the Range, Mean, Median and Mode. It is also really fun to compare y
Subjects:
Grades:
5th - 7th, Staff
Mr. Duey- Hip Hop Song Teaching Mean, Median and Mode
This song teaches about Mean, Median, Mode and Range. This song does the definition and provides examples.
Subjects:
Grades:
PreK - 12th, Higher Education, Adult Education, Staff
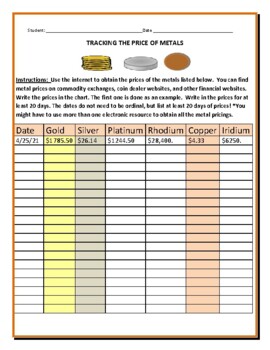
ECONOMY/FINANCE/MATH: TRACKING THE PRICE OF METALS GRS. 6-12, MG, VOCATIONAL
Students use the internet to track the prices of several important metals. They list the prices for a total of 20 days. The first one is done as an example. There are several websites or electronic resources to find the prices. Apmex is one for some of the metals. Other metals can be researched on metal exchanges. Use this activity in lieu of a quiz grade. Thanks so much for visiting. We are humbled. Knowledge is power!
Subjects:
Grades:
6th - 12th, Higher Education, Adult Education, Staff
Showing 1-24 of 35 results


