
Measures of Variability Coloring Activity | Range & Interquartile Range Activity

- PDF
What educators are saying
Also included in
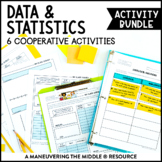 This Data and Statistics Activity Bundle includes 6 classroom activities to support statistical questions, histograms, box plots, measures of center and measures of variability. These hands-on and engaging activities are all easy to prep! Students are able to practice and apply concepts with thesePrice $11.00Original Price $15.00Save $4.00
Description
This Measures of Variability Solve and Color consists of 8 problems where students will calculate the range or IQR from a data set, dot plot or table. Then, they will locate the answer and color the picture accordingly.
This activity is great for in class practice or as a way to spice up independent work! Students can color, while still applying their understanding of measures of variability.
Students are able to practice and apply concepts with this measures of variability activity, while collaborating and having fun! Math can be fun and interactive!
Standards: CCSS (6.SP.3, 6.SP.5c) and TEKS (6.12C)
More details on what is included:
One ready-to-print page with 8 measures of variability problems. It can be utilized individually or in pairs or groups.
One Page: 8 Measures of Variability Problems
- Recording Sheet
- Coloring Page
- Teacher Directions
- Answer Key
***Please download a preview to see sample pages and more information.***
How to use this resource:
- Use as a whole group classroom activity
- Use in a small group for additional remediation, tutoring, or enrichment
- Use as an alternative homework or independent practice assignment
- Incorporate within our Data and Statistics Unit to support the mastery of concepts and skills.
Time to Complete:
- Most activities can be utilized within one class period. Performance tasks summarize the entire unit and may need 2-3 class periods. However, feel free to review the activities and select specific problems to meet your students’ needs and time specifications. There are multiple problems to practice the same concepts, so you can adjust as needed.
Looking for instructional materials?
- Check out the corresponding Data and Statistics Unit, which includes student handouts, independent practice, assessments, and answer keys.
More 6th Grade Activity Bundles:
Unit 8: Equations and Inequalities
Unit 9: Geometry
Unit 10: Statistics
More 6th Grade Units:
Unit 8: Equations and Inequalities
Unit 9: Geometry
Unit 10: Statistics
Looking for more helpful teaching tips, ideas, and support? Check out Maneuveringthemiddle.com and join our online FB community MTM VIPS!
Try out a FREE math resource! Grab your freebie here!
Licensing:
This file is a license for ONE teacher and their students. Please purchase the appropriate number of licenses if you plan to use this resource with your team. Thank you!
Customer Service:
If you have any questions, please feel free to reach out for assistance. We aim to provide quality resources to help teachers and students alike, so contact me before leaving feedback if you have a need.
Maneuvering the Middle® Terms of Use
Products by Maneuvering the Middle®, LLC may be used by the purchaser for their classroom use only. This is a single classroom license only. All rights reserved. Resources may only be posted online in an LMS such as Google Classroom, Canvas, or Schoology. Students should be the only ones able to access the resources. It is a copyright violation to upload the files to school/district servers or shared Google Drives. See more information on our terms of use here.
If you are interested in a personalized quote for campus and district licenses, please click here.
©Maneuvering the Middle® LLC, 2012-present
