Chance and Probability Activities Theoretical & Experimental Probability Bundle
- Zip
What educators are saying
Products in this Bundle (8)
showing 1-5 of 8 products
Description
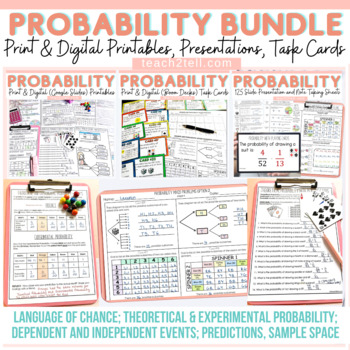
Are you teaching your students all about chance and probability and looking for fun hands-on probability activities? This print and digital bundle of worksheets, task cards, slideshows and note-taking sheets on Probability will reinforce the understanding of theoretical probability, experimental probability, language of chance, sample space, predictions, lists, tree diagrams, dependent probability events and independent probability events.
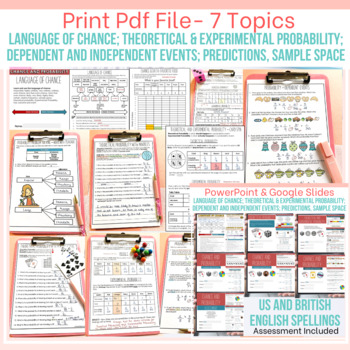
Both US and British English spelling and terminology files included.
Resources in this Bundle:
- Sheets (Pdf) x 80
- Sheets Digital (PowerPoint) x 80
- Sheets Digital (Google Slides) x 80
- Assessment (print & digital) 61 questions
- Teacher's Copy for all 7 units - explicit working out key for each problem
- Cover Sheet (student) For all 7 units - compile all sheets into a booklet, this eliminates the need for students to write their names on each page.
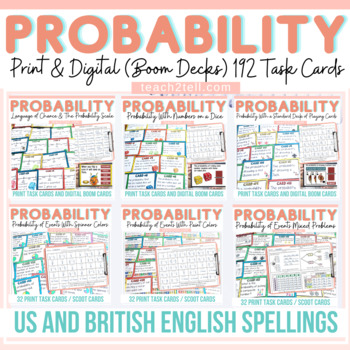
2. Print and Digital Task Cards
- 192 Print Task Cards
- Recording Sheets
- Answer Key
- Language of Chance Boom Deck
- Probability With A Standard Dice Boom Deck
- Probability With Playing Cards Boom Deck
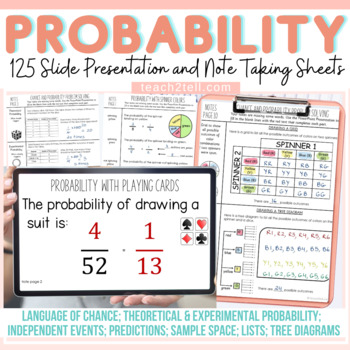
- PowerPoint Presentations - 125 Slides
- 32 Cornell Style Note-taking Sheets
_____________________________________________________
Overview of Activities
1. The Probability Scale; Words Describing Chance:
- Definitions and given scenarios
- Chance and Data (language of chance); class surveys
2a. Theoretical Probability: Manipulatives
- spinner numbers
- spinner names
- spinner colors
- marbles
- dice numbers
- playing cards
2b. Theoretical Probability: Tree Diagrams and Grids
- possible outcomes of two coins using a tree diagram and a grid
- possible outcomes of a coin and a dice using a tree diagram and a grid
- possible outcomes of a dice and a spinner using a tree diagram and a grid
3a. Theoretical and Experimental Probability:
- Rolling a six-sided dice a given number of times.
- Tossing two coins a given number of times.
- Spinning a spinner a given number of times.
- Picking an M&M color a given number of times.
3b. Experimental Probability:
- Dice roll to find the number of trials and relative frequency of the numbers rolled.
- Group experiment to toss a coin a given number of times and record the total heads, total tails, total outcomes, and relative frequencies of heads and tails (fractions and decimals) for each group. This is to prove the law of large numbers that indicate that as the number of trials increase, the relative frequencies tend to get closer to the expected value (0.5) of tossing a coin.
4. Word Problems for both theoretical and experimental probability outcomes:
Nature of Problems (sample space, lists, tree diagrams)
- Picking a favorable outcome from given possible outcomes.
- Problems pertaining to coin tosses and dice rolls
- Real-life problem: left-handed, right-handed people
- Problems involving possible combinations shown via a tree diagram
- Problems with Spinner spins
5. Independent Probability Events
Determining the Independent Probability of events using:
- Playing Cards
- Dice Numbers
- Coin Tosses
- M&M's Candy
- Spinners
- Word Problems
- Lists and Tree Diagrams
6. Dependent Probability Events
Determining the Dependent Probability of events using:
- Playing Cards
- Visual Images
- Letter Tiles
- Marbles
- M&M's Candy
- Word Problems
7. Assessment
- 10 Print and Digital Sheets comprising 61 questions.
______________________________________________
Also Included In
Related Resources
- Graphs Mega Bundle
- Budgeting Plans and Graphing
- Fractions Bundle
- Subitizing Number Sense Building
- Place Value Bundle
- Mental Multiplication Strategies
Thank you for visiting Teach2Tell. New resources are 50% off - do follow the store to get notified :)
Please contact me with any queries regarding this resource.
Thank you!
Laurane@teach2tell.com


