Bar Graphs Pictographs Line Graphs Line Plots Pie Charts Data Collection Bundle
- Zip
What educators are saying
Products in this Bundle (6)
showing 1-5 of 6 products
Bonus
Also included in
- Are you looking for a comprehensive Math Curriculum bundle that includes a variety of resources and activities that cover 4th Grade, 5th Grade, and 6th Level standards?This Math Curriculum Bundle has a range of print and digital resources to teach and reinforce key math concepts aligned to the stanPrice $58.50Original Price $116.10Save $57.60
Description
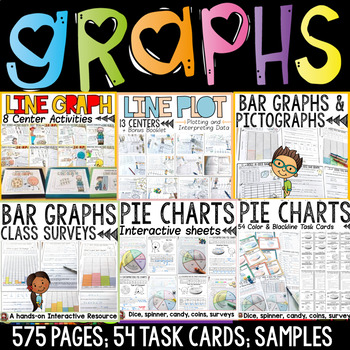
The graphing bundle features interactive activities for creating and interpreting bar graphs, pictographs, line graphs, line plots and pie charts.
Your entire graphing unit for a year!
Separate folders featuring both British English and US spellings and terminology included.
Great quality and value for this whopping 575 + page unit on graphing!
Data is collected and interpreted using concrete materials such as visuals, dice, spinners, coins and other real-life objects and contexts. Further details about the graphs featured in this pack are:
This graphing unit features interpreting data in bar graphs and pictographs. Data is
collected using concrete materials such as visuals, dice, spinners, coins and M&M’s .
This data is then represented in bar graphs and interpreted. The section on pictographs requires collected data to be interpreted. These no prep printables facilitate students to move from the concrete to the abstract. Access the link above to read more about the bar graphs and pictographs included.
This Bar Graphs Class Surveys collection features collecting, graphing and interpreting data on topics your students will relate to. This is perfect for a getting-to-know-you back to school activity, or alternatively for applying graphing skills in real life situations.
Items Included
- 12 Class Surveys on topics of interest.
- Choice of three Cover Sheets if compiling student surveys into a booklet.
- Vocabulary Cards featuring mathematical terminology.
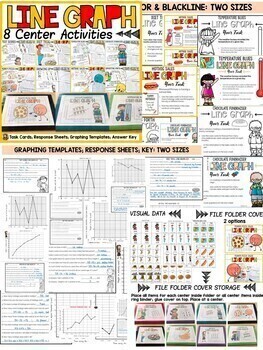
This is a 145 page unit on Line Graphs that contains visual interactive activities to collate, record and interpret data in line graphs.
Items Included
- 8 center Activities (color and blackline): for each center activity students will follow the instructions on a task card to plot data on a line graph and interpret data plotted on a response sheet
- Vocabulary/ mathematical terminology cards display
- Line Graph Poster/Anchor Chart
- Center Checklist
Each Line Graph Center Activity Includes
- File folder cover (2 options): if placing all items in a file at a center
- Single large task card (color and blackline) on a sheet outlining the task
- Two small task cards (color and blackline) on a sheet outlining the task
- Line graph sheet to plot data (single- large and two small on a sheet)
- Response Sheet to interpret data (single- large and two small on a sheet)
- 8-12 visual data cards
- Sample Response /Answer Key (single- large and two small on a sheet)
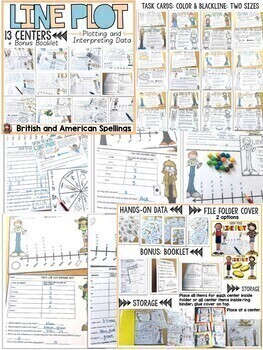
This is a 226 page fun section featuring 13 centers and a bonus booklet on Line Plots. Activities cover all key mathematical concepts and strategies to collate and display data in fractions of a unit using interactive materials like visual cards, dice, spinners and real-life data. This unit is aligned with the Common Core Standards 4.MD.B4 and 5.MD.B2 that involves displaying a data set of measurements in fractions of a unit (1/2, 1/4, 1/8) and solving problems involving addition and subtraction of fractions by using information presented in line plots.
5. Pie Charts Print-N-Go-Sheets
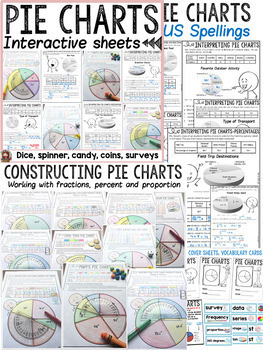
This pack of no-prep printables on Pie Charts features hands-on interactive activities to collate, record, construct and interpret data in pie charts. Work in this unit is divided into two sections:
I. Reading and Interpreting Pie Charts
Data sets are represented in fractions and percentages. Students interpret data represented in tally tables and pie charts. Each graphing activity includes target questions that interpret data and is accompanied with a completed sample. There are seven pie charts under this section.
II. Constructing Pie Charts
Activities in this section require students to represent data from tally tables, class surveys and hands-on materials like dice, spinners, M&M’s and coins in pie charts. Step-by-step instruction facilitates the construction of the proportion of each sector that make up a pie chart using a protractor. There are nine pie charts under this section.
This pack also includes 12 cards that feature key mathematical vocabulary, choice of 3 cover templates if collating all sheets into a booklet and 1 poster.
Suggested Use
- As a follow-up to an instructed lesson on pie charts.
- As a practice and assessment activity.
- At Independent Math Centers or Work Stations
- Morning Work
- Early finishers
- Homework folder
6. Pie Charts 54 Task Cards (color)
Pie Charts 54 Task Cards (Black and White)
1. Reading and Interpreting Pie Charts – Section 1
There are 44 color and blackline task cards in this section comprising of two student answer response sheets. Answers to all 44 questions included.
2. Constructing and Interpreting Pie Charts – Section 2
This section has 6 color and blackline task cards that require students to collect real-life data via class surveys. Collected data is tabulated and represented in a pie chart. Students use a protractor to construct the degrees of each sector. There are 12 response sheets (2 per page) to represent and interpret data collected in pie charts.
3. Constructing and Interpreting Pie Charts – Section 3
There are 4 color and blackline task cards that require students to use hands-on materials (dice, spinners, M&M’s and coins) to collect data. There are 8 response sheets (2 per page) to represent and interpret collected data in pie charts. Students use a protractor to construct the degrees of each sector.
In addition, there are 12 vocabulary cards featuring key mathematical terminology and 1 poster defining and explaining the concept of pie charts.
►► A completed sample of each graphing activity is included.
Also Included In
Related Resources
- Chance and Probability Bundle
- Budgeting Plans and Graphing
- Fractions Bundle
- Subitizing Number Sense Building
- Place Value Bundle
- Mental Multiplication Strategies
Thank you for visiting Teach2Tell. New resources are 50% off - do follow the store to get notified :)
Please contact me with any queries regarding this resource.
Thank you!
Laurane@teach2tell.com


